Support and Resistance in Forex: How to Read the Levels
Short answer: Support is a price area where a fall has stopped or slowed before. Resistance is a price area where a rise has stalled before. Traders mark these zones on a chart to plan entries, pending orders and stop losses. They are zones, not exact lines, and any of them can fail.
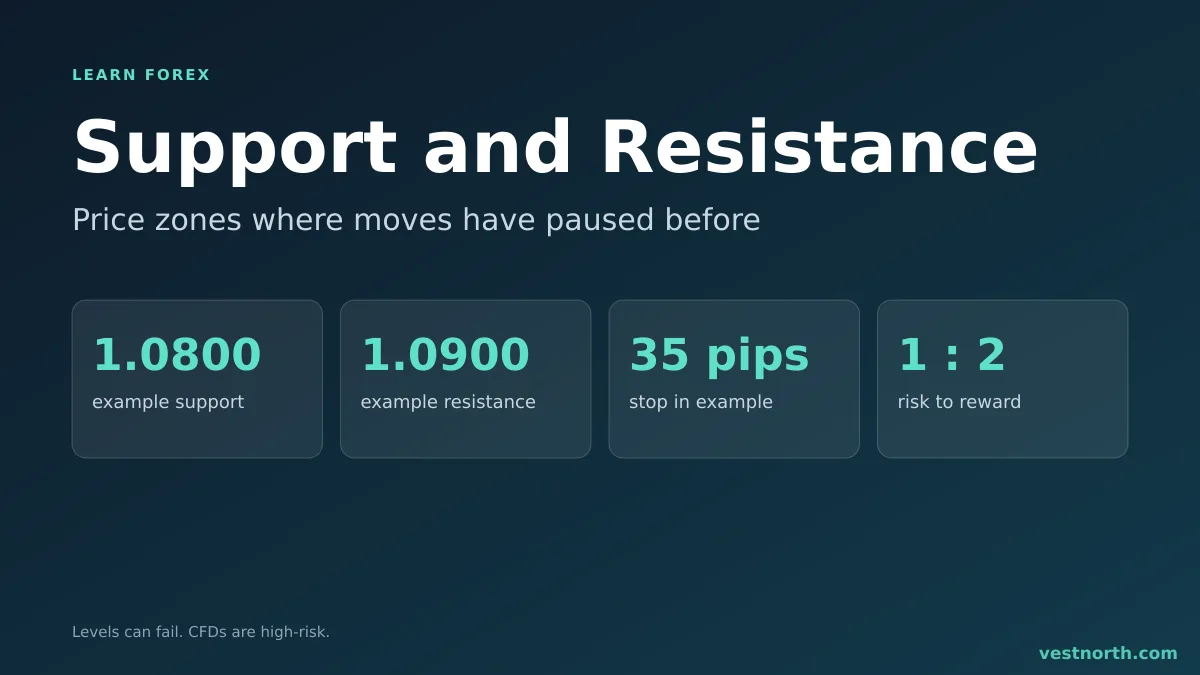
A range between support near 1.0800 and resistance near 1.0900. Illustration with example prices, October 2026.
What support and resistance mean
Price does not move in a straight line. It rises, pulls back, and rises again, and it often reverses around the same areas more than once.
- Support sits below price. In the past, buyers outnumbered sellers there, so the fall paused or reversed.
- Resistance sits above price. In the past, sellers outnumbered buyers there, so the rise paused or reversed.
The idea rests on memory. Traders remember where price turned, place orders there again, and those orders can make the area matter again. There is no rule that forces it to work, which is why support and resistance describe where reactions have happened, not where they will.
How to mark the levels
A practical method for beginners:
- Start on a higher time frame. Open the daily chart. Levels from higher time frames are watched by more traders than levels from a 5-minute chart.
- Find turning points. Mark the areas where price turned at least twice. Round numbers such as 1.0800 or 1.1000 often attract orders, so they are common anchors.
- Draw a zone, not a line. Price rarely turns at the exact same pip. Shade a band of perhaps 10 to 20 pips on EUR/USD, wider on volatile pairs.
- Keep it clean. Five or six clear levels beat thirty lines that cover the chart.
- Drop to a lower time frame only to time the entry.
The right band width depends on the pair and time frame. A pair that normally moves 80 pips a day needs a wider zone than a quiet one. Check it on a demo account.
A worked example in pips
EUR/USD has bounced from around 1.0800 twice and turned down from around 1.0900 twice. That is a 100-pip range.
| Idea | Level |
|---|---|
| Support zone | 1.0800 to 1.0810 |
| Resistance zone | 1.0890 to 1.0900 |
| Buy near support | 1.0815 |
| Stop loss below the zone | 1.0780 (35 pips from entry) |
| Take profit below resistance | 1.0885 (70 pips from entry) |
The risk is 35 pips and the possible gain is 70 pips, a risk-reward ratio of 1 to 2. On 0.1 lot, at about $1 per pip, that is about $35 at risk and $70 targeted, before spread and costs. Use the lot size calculator to size the trade from the stop distance, as covered in forex position sizing.
The stop sits beyond the zone, not inside it. If price closes through the support zone, the idea is wrong and the stop closes the trade.
Breakouts and role reversal
When price breaks through a level, the level often changes role.
- A broken resistance can become support on the way back down to it.
- A broken support can become resistance on the way back up.
In the example, if EUR/USD closes above 1.0900 and later falls back to that area, traders may watch 1.0900 as new support. Waiting for that retest is a common alternative to buying the first break.
Breakouts also fail. Price can poke above a level, trigger orders, and return inside the range. These false breakouts are common around news releases, so a calendar helps. See the forex economic calendar.
Why levels fail
Levels are not walls. Reasons they break or never hold:
- A strong news release can push price straight through.
- A level tested many times has fewer orders left behind it, so it can weaken.
- Your levels may differ from other traders’ levels, and nobody has a view of all the orders.
- The spread can hit a tight stop. Remember that a sell is stopped out by the ask, as covered in bid and ask price.
- Thin trading, such as around the daily rollover, produces spikes. See forex trading sessions.
For these reasons, never rely on a level without a stop loss.
Using levels with orders
Support and resistance feed straight into order placement.
- A buy limit below price near support, or a sell limit above price near resistance, waits for a pullback to the level.
- A buy stop above resistance, or a sell stop below support, waits for a breakout. A stop order fills at the market price once it triggers, so it can slip. See slippage in forex.
- A stop loss goes beyond the level that would show the idea is wrong.
- A take profit often sits just before the next opposite level, because price may stall there. See what a take profit order is.
Forex order types covers each order in detail.
Common mistakes
- Treating a level as an exact price and placing a stop one pip beyond it.
- Marking dozens of levels until every price is near one.
- Using levels from a 1-minute chart for a position meant to last days.
- Entering again and again at a level that has already failed.
- Ignoring a scheduled news event when a level is close.
Write the rules you will follow in a trading plan, and keep risk per trade small, as in forex risk management.
Related chart patterns and levels: the head and shoulders pattern, round-number levels and flag and pennant patterns.
Bottom line
Support and resistance are zones where price has paused or turned before. Mark them on a higher time frame, draw a band instead of a line, and place the stop on the far side of the zone. Expect some levels to break and some breakouts to fail. Test the approach on a demo account, and only trade with money you can afford to lose. CFDs are complex, high-risk instruments.
Frequently asked questions
What is support in forex?
Support is a price area below the current price where a fall has stopped or slowed before. Buyers have stepped in there in the past, so traders watch it for a possible bounce.
What is resistance in forex?
Resistance is a price area above the current price where a rise has stalled before. Sellers have been active there, so traders watch it for a possible turn down.
How do I draw support and resistance levels?
Look at a higher time frame such as the daily chart and mark price areas where price turned at least twice. Draw a zone a few pips thick rather than a single exact line.
What happens when support is broken?
A broken support level often becomes resistance when price returns to it from below, and a broken resistance can become support. This is called a role reversal and it is common but not certain.
Are support and resistance levels reliable?
No level is certain. Price can pass through any of them, and a level that held several times can fail on the next test, especially around news. Use a stop loss on every trade.
Which time frame is best for support and resistance?
Levels from higher time frames such as the daily and weekly charts are seen by more traders than levels from a 5-minute chart. Many traders mark levels on the higher chart and enter on a lower one.