Forex Flag and Pennant Patterns: How They Form, How to Read Them and Where They Fail
Short answer: A flag is a small tilted channel that forms after a sharp move (the pole). A pennant is the same idea but the pause forms a small triangle. Both are read as continuation patterns, meaning price may resume in the direction of the pole after a breakout. Neither is reliable on its own. Use a stop loss beyond the pattern and size the trade from that distance.
Flag and pennant anatomy. Illustration, October 2026.
The three parts
Both patterns share the same structure:
- The pole. A strong, fast move in one direction, usually a run of large candles. See trend trading basics.
- The consolidation. A short pause where price moves sideways or against the pole with smaller candles.
- The breakout. Price leaves the consolidation. If it leaves in the direction of the pole, traders call it a continuation.
The pole matters. A flag after a weak drift is just a channel. The pattern needs a sharp, obvious move first.
Flag vs pennant
| Feature | Flag | Pennant |
|---|---|---|
| Shape of the pause | Two parallel lines, tilted | Two converging lines, small triangle |
| Slope | Against the pole | Often flat or slightly tilted |
| Candle size | Smaller than the pole | Shrinking as it narrows |
| Typical length | Short compared with the pole | Short compared with the pole |
A bull flag follows a sharp rise and drifts down a little. A bear flag follows a sharp fall and drifts up a little. A bull pennant forms after a rise, and a bear pennant after a fall. The lines in a pennant meet at a point, as in a triangle pattern.
A worked example
This example uses made-up prices on EUR/USD to show the arithmetic. It is not a real trade.
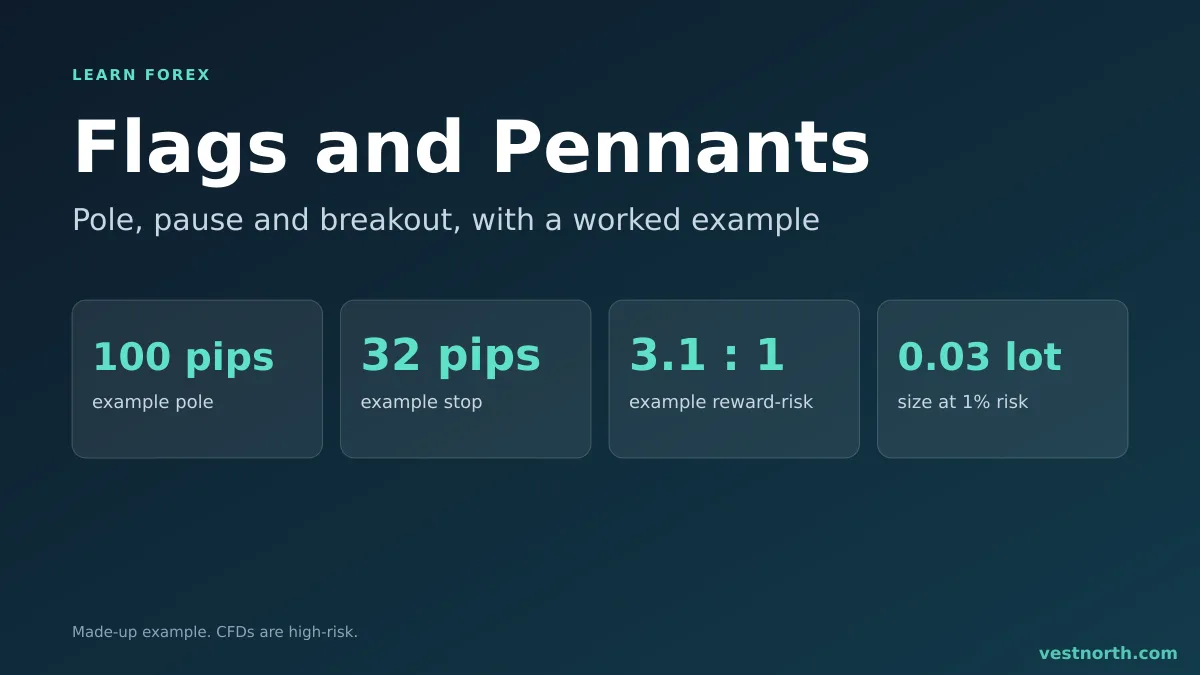
- The pole: price rises from 1.1000 to 1.1100, a 100-pip move.
- The flag: price drifts down to 1.1070 in a tilted channel over several candles. The top line of the flag sits near 1.1090.
- Entry idea: a candle closes above the flag’s upper line at 1.1092.
- Stop loss: below the flag low, at 1.1060. That is 32 pips from entry.
- Target idea: some traders project the pole length from the breakout, which would be 1.1092 + 0.0100 = 1.1192. That is 100 pips, a reward-to-risk ratio of about 3.1 to 1.
If the account is $1,000 and the risk rule is 1% ($10), then 32 pips of stop means a size of about 0.03 lot (about $0.30 per pip, so about $9.60 at risk). The lot size calculator and position sizing guide show the formula, and the risk reward ratio page explains what 3 to 1 means. A projected target is a guess, so many traders take partial profit earlier.
Where flags and pennants fail
- The breakout is a fakeout. Price closes outside, then returns inside and hits your stop. See fakeouts.
- The pause is too long. A consolidation that stretches to a large share of the pole length is often a range, not a flag. See range markets.
- News interrupts it. A release can end the pattern in seconds. Check the economic calendar.
- No room to run. A target that sits beyond nearby support and resistance may stall before it is reached.
- Wide spreads or slippage. Breakout entries are exposed to both. See slippage.
How to read the pattern step by step
- Mark the pole: the start and end of the sharp move.
- Draw the two lines around the pause with at least two touches each.
- Note the direction: with the pole means continuation, against it means the idea is off.
- Choose an entry rule, such as a candle close beyond the line, or a pending stop order placed just beyond it. See pending orders.
- Place the stop loss beyond the opposite side of the pattern and compute the lot size from that distance.
- Write the target and the reason in your journal.
Practice before real money
Draw flags on past charts and count how many broke out with the pole and how many did not. A demo account lets you try the entries without risk. See demo accounts. Your own count on your own pair and timeframe is more useful than any general claim about success rates.
Bottom line
Flags and pennants are short pauses after a sharp move that traders use to look for a continuation. They fail often, so each trade needs a stop beyond the pattern and a position size built from that stop. Check the pole, wait for a close beyond the boundary, and watch for news and nearby levels. Only risk money you can afford to lose. CFDs are complex, high-risk instruments.
Frequently asked questions
What is a flag pattern in forex?
A flag is a short, tilted rectangle of price that forms after a sharp move, called the pole. It slopes against the move and is read as a pause before the trend may continue.
What is the difference between a flag and a pennant?
A flag has two roughly parallel trend lines. A pennant has two converging lines that form a small triangle. Both appear after a sharp move and are both continuation patterns.
How do you trade a flag pattern?
Many traders wait for a candle to close beyond the flag boundary in the direction of the pole, place a stop loss on the other side of the pattern, and set a target based on the pole length.
How reliable are flags and pennants?
They fail often, and we have no verified statistics to quote. Treat each one as a trade idea with a stop loss, not as a signal that a trend will continue.
How long should a flag last?
Flags are usually short compared with the pole, often a handful of candles on the chart you use. If the pause drags on, the pattern is weaker.
Are flags bullish or bearish?
Both exist. A bull flag follows a sharp rise and slopes down slightly. A bear flag follows a sharp fall and slopes up slightly.