What Is a Forex Range Market and How Do You Trade It?
Short answer: A range market is a stretch where price moves sideways between a lower level (support) and an upper level (resistance). Range traders look to buy near the bottom and sell near the top, with a stop loss just outside the range. The main risk is the breakout: when price leaves the range and keeps going, the trade against it loses.
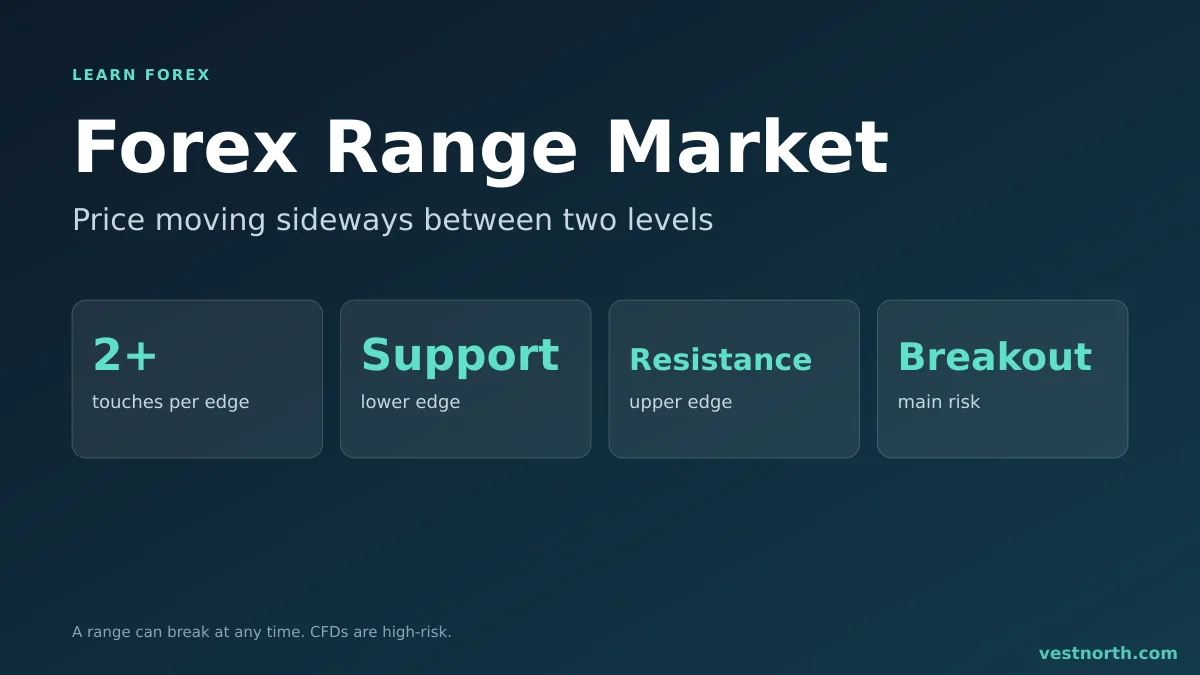
Price between support and resistance, with a break above the range. Illustration, October 2026.
What a range looks like
In a trend, price makes a series of higher highs and higher lows (uptrend) or lower highs and lower lows (downtrend). In a range, neither happens. Price bounces off the same two areas again and again.
Signs of a range:
- At least two touches of the upper level and two of the lower one.
- Flat moving averages that price crosses back and forth.
- Candles that fail to close beyond either edge for several sessions.
Pairs often range when big news is missing, or when traders wait for a central bank decision. The Asian session is known for quieter trading on many pairs; the trading sessions guide explains why.
Range or trend: a quick comparison
| Feature | Range market | Trending market |
|---|---|---|
| Highs and lows | Roughly equal | Rising or falling |
| Moving averages | Flat, crossed often | Sloped, price on one side |
| Oscillators (RSI, stochastic) | Swing between extremes | Stick at one extreme |
| Typical approach | Trade the edges | Trade pullbacks with the trend |
| Main risk | Breakout against you | Reversal or deep pullback |
Markets switch between the two, and a range often sits between two trends. See trend trading basics for the other side.
How to draw the range
- Mark the swing highs that line up and draw the upper level.
- Mark the swing lows that line up and draw the lower level.
- Treat each level as an area of a few pips, not an exact line, using the same approach as in support and resistance.
- Mark the middle of the range. The target for an edge trade is often the opposite edge or the middle.
Ways to trade a range
Fade the edges. Buy near support and sell near resistance, waiting for a sign that price is turning, such as a rejection candle. The stop goes just outside the range.
Use an oscillator as a filter. A buy near support is stronger if the RSI or the stochastic is also low. This does not make the trade safe. It only filters out trades taken in the middle of the range.
Wait for the break. Some traders skip the bounces and trade only the exit, using the rules in the breakout guide.
A worked example with invented prices
GBP/USD has bounced between 1.2600 (support) and 1.2700 (resistance) for two weeks. A trader sells near 1.2695 after a rejection candle at resistance.
| Item | Price | Distance |
|---|---|---|
| Entry (sell) | 1.2695 | |
| Stop loss | 1.2720 | 25 pips |
| Target 1 (middle) | 1.2650 | 45 pips |
| Target 2 (support) | 1.2610 | 85 pips |
Risk is 25 pips for a first target of 45 pips (1.8 to 1) or a second target of 85 pips (3.4 to 1). The prices are illustrations, not a forecast. If price closes above 1.2700 and holds, the range may be ending, and the 25-pip loss is the planned cost of being wrong. The risk-reward guide explains how to judge whether a ratio is worth taking.
To turn the 25 pips into a lot size, use the lot size calculator with the amount you accept to lose.
When the range breaks
A range always ends at some point, and that is where range traders lose most. Two outcomes:
- Breakout: price closes beyond the edge and keeps going. Every fade trade at that edge is a loss.
- Fakeout: price spikes through the edge, then returns inside. Breakout traders who entered early are caught. See the fakeout guide.
Practical safeguards: keep the stop outside the range, never add to a losing fade, and watch for volatility rising. A sudden jump in candle size is often the first sign. The volatility guide covers how to read it. Scheduled news such as rate decisions can break a range within seconds, and slippage can fill a stop at a worse price than planned.
Costs matter more in a range
Range trades target small distances, so the spread takes a larger share of the profit. On the example above, a 1.5-pip spread removes 1.5 of a 45-pip target. On a narrow range of 30 pips, the same spread is 5% of the whole range. Check the cost at your broker before you decide whether a narrow range is worth trading at all.
Common mistakes
- Calling a range after a single bounce.
- Fading the edge with no stop loss because “it always comes back”.
- Trading the middle of the range, where there is no edge.
- Moving the stop further out once price pushes against the trade.
- Using range tools in a trend, which is where oscillators give repeated early signals.
Related chart patterns and levels: trading with trend lines, pullback trading and channel trading.
Bottom line
A range market is price moving sideways between support and resistance. It can be traded from the edges with a stop just outside, but it can break at any time, and the break is where losses build. Confirm the range with several touches, size the trade from the stop distance, and accept that a planned loss is part of the method. Only risk money you can afford to lose, because leveraged CFDs can lose value quickly.
Frequently asked questions
What is a range market in forex?
A range market is a period when price moves sideways between a lower level (support) and an upper level (resistance), without making clear higher highs or lower lows.
How do I know if a market is ranging?
Look for at least two touches of the upper level and two of the lower level, flat moving averages and price crossing the middle of the range several times. A trend shows a series of higher highs and higher lows, or lower highs and lower lows.
How long does a range last?
There is no fixed length. Ranges can last a few hours or many weeks, and nobody can tell in advance when one will end.
Where should I put the stop loss in a range trade?
Beyond the edge you are trading from, with room for the spread and normal noise. If price closes outside the range, the idea is wrong and the stop should do its job.
Which indicators suit a range market?
Oscillators such as the RSI and the stochastic are common choices, because they swing between extremes when price moves sideways. They give many false signals once a trend starts.
What happens when a range breaks?
Price may leave the range and keep going (a breakout), or leave briefly and return (a fakeout). Waiting for a candle to close outside the range, and for the level to hold on a retest, reduces but does not remove false breaks.