What Is the Stochastic Oscillator in Forex?
Short answer: The stochastic oscillator is a line between 0 and 100 that shows where the latest close sits inside the recent high-low range. A reading near 100 means the close is at the top of the range, and near 0 means it is at the bottom. Lines at 80 and 20 are the usual markers, and a move past them is not a buy or sell signal by itself, because price can stay there for a long time in a trend.
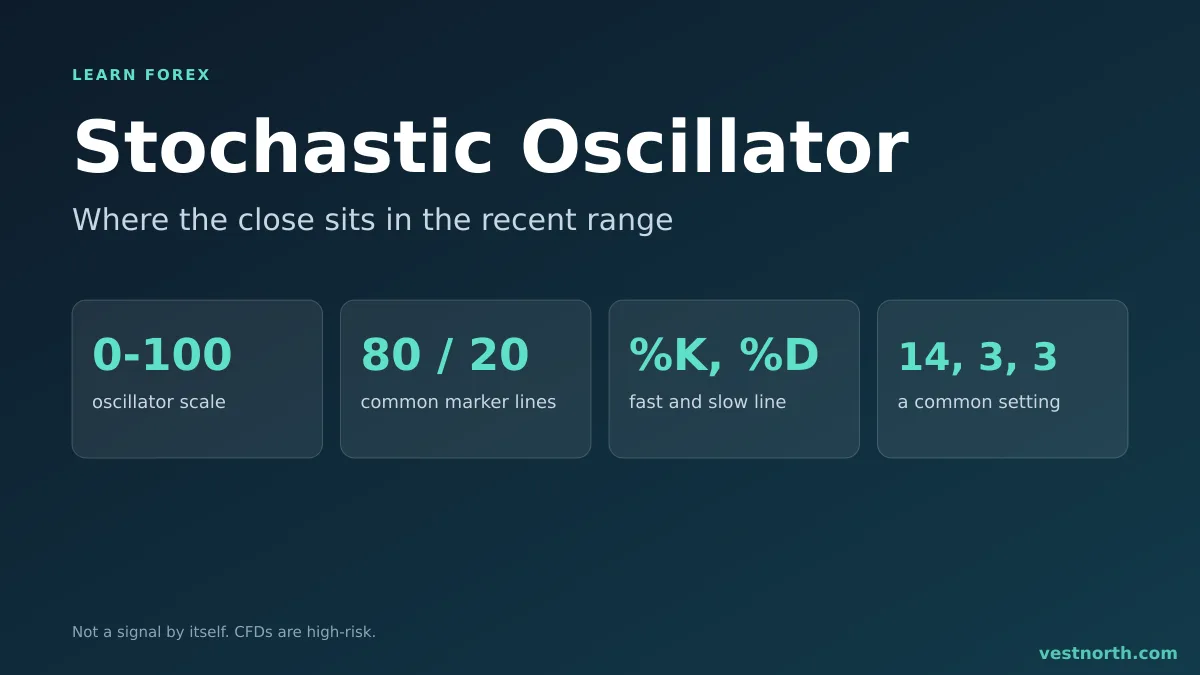
The stochastic with its 80 and 20 lines and a %K and %D cross. Illustration, October 2026.
How the stochastic is calculated
The indicator asks one question: is the close near the top or the bottom of what price has done lately? For a 14-candle setting:
%K = (latest close − lowest low of 14 candles) ÷ (highest high of 14 candles − lowest low of 14 candles) × 100
A worked example with made-up numbers. Over the last 14 candles on EUR/USD the highest high is 1.0900 and the lowest low is 1.0800, a range of 100 pips.
| Latest close | Distance above the low | ÷ range | %K |
|---|---|---|---|
| 1.0890 | 90 pips | 0.90 | 90 |
| 1.0850 | 50 pips | 0.50 | 50 |
| 1.0815 | 15 pips | 0.15 | 15 |
The prices are illustrations, not a forecast. Your platform does the maths, but knowing it explains the readings: a stochastic at 90 does not say price will fall. It says the close is in the top tenth of the recent range.
%K, %D and the three settings
The chart shows two lines.
- %K is the line above, called the fast line when it is not smoothed.
- %D is a moving average of %K, so it trails behind and looks smoother.
The settings are usually written as three numbers, such as 14, 3, 3: the look-back period for the range, the smoothing applied to %K, and the length of the %D average. Platforms ship different defaults, and 5, 3, 3 is also common. A shorter look-back reacts faster and produces more crosses, many of them false. Check what your own platform uses before you compare screenshots with anyone else’s.
A “slow” stochastic is one where %K is already smoothed. A “fast” one is not. Many charting packages show the slow version without labelling it, which is another reason two traders can see different lines on the same chart.
The 80 and 20 levels
Most platforms draw horizontal lines at 80 and 20. Above 80 is called overbought and below 20 oversold. Those words suggest a reversal is due, and that is the trap. The lines only say the close is within 20% of the edge of the recent range.
In a strong uptrend the stochastic can sit above 80 for days, because each new high pushes the range up with it. Sellers who act on the first reading above 80 are trading against the trend. The same applies in reverse below 20.
The levels are most useful in a range market, where price keeps returning to the middle. In a trend, a pullback that takes the stochastic down to 20 and back up may help time an entry in the direction of the trend. The trend trading guide covers the trend side.
Crosses and divergence
Two signals get most of the attention.
- %K crossing %D. When %K crosses above %D, momentum is turning up, and a cross below says it is turning down. Crosses that happen in the middle of the scale (around 50) carry little information. Traders usually wait for a cross near 80 or 20.
- Divergence. Price makes a new high but the stochastic makes a lower high, or price makes a new low and the stochastic makes a higher low. Some traders read it as weakening momentum. It can appear several times before a turn, or not at all.
Both signals lag. A cross is confirmed only after the candle closes, so by then part of the move has often happened.
Where the stochastic goes wrong
- Trending markets. It stays at an extreme and gives repeated early counter-trend signals.
- Low time frames. On a 1-minute or 5-minute chart, the oscillator swings from 0 to 100 within a few candles, mostly on spread and noise.
- News releases. A single spike candle drags the range wide and pushes the reading to an extreme for no lasting reason.
- Stacking indicators that say the same thing. Using the stochastic, the RSI and a third momentum line together gives three versions of one view, not three confirmations.
Worked example: the same signal in a range and in a trend
Both cases use made-up EUR/USD prices and a 14-candle stochastic. They are illustrations, not forecasts.
In a range. Price has bounced between 1.0800 and 1.0900 for two weeks. The stochastic drops below 20 as price reaches 1.0815 and %K turns up through %D. A trader who buys there with a stop at 1.0790 (25 pips below) and a target at 1.0870 (55 pips above) risks 25 pips to make 55, a reward-to-risk ratio of 2.2. The edge comes from the range holding, not from the indicator.
In a trend. Price is climbing and the stochastic has been above 80 for nine candles. A trader sells at 1.0880 on the first reading above 80, with a stop at 1.0910 (30 pips). Price rises to 1.0960, the stop is hit, and the loss is 30 pips. On 0.1 lot that is $30 on EUR/USD ($1 per pip). The indicator was “overbought” the whole way up.
The two trades used the same signal. What differed was the market type, which is why checking for a range or a trend first, with a tool such as the ADX or a moving average, matters more than the oscillator reading. For setting the target against the stop, see the risk-reward ratio.
How the smoothing changes the line
The fast stochastic is %K as calculated above. The slow version averages it. Using the three latest fast readings of 88, 79 and 64:
| Line | Calculation | Value |
|---|---|---|
| Fast %K | latest reading | 64 |
| Slow %K (3-candle average) | (88 + 79 + 64) ÷ 3 | 77 |
The slow line is still high while the fast line has already dropped 24 points. That lag is why slow crosses are fewer and later.
The look-back also changes what “recent” means:
| Setting | Time frame | Range covers |
|---|---|---|
| 5, 3, 3 | 1-hour chart | last 5 hours |
| 14, 3, 3 | 1-hour chart | last 14 hours, about a day of the London and New York sessions |
| 14, 3, 3 | Daily chart | last 14 trading days, about three weeks |
The same “20” reading therefore means something very different on each row. Compare readings only between charts with identical settings and time frames.
Stochastic and Williams %R: the same maths on a flipped scale
Williams %R uses the same ratio as the stochastic’s raw %K, but plots it from 0 down to -100 instead of 0 to 100. With the same lookback, %R = %K - 100. A stochastic reading of 90 is a Williams %R of -10, and a reading of 15 is -85. The 80 and 20 levels become -20 and -80. If a platform offers both, you are not getting two independent signals, only two views of one calculation, so there is no benefit in requiring both to agree.
Stochastic vs RSI
Both are oscillators with 0 to 100 scales and similar-looking charts. The RSI compares the size of average up moves with average down moves. The stochastic ignores move size and looks only at where the close sits in the range. In a quiet range the two often agree. In a sharp trend they can disagree, and choosing the one that supports your trade is a habit to avoid.
Using it with risk control
An oscillator cannot tell you where you are wrong. Put the stop loss beyond a level that cancels your trade idea, such as a swing point or a zone from support and resistance, then size the position from that distance. Work out the distance in pips with our guide to what a pip is, then combine it with the lot size calculator so a failed signal costs an amount you chose in advance.
A practical routine for a beginner: switch the stochastic on in a demo account, mark every cross near 80 or 20 on a chart for a few weeks, and record how often price kept going the other way. The result is your own evidence, and it will likely show why the indicator is a filter, not a trigger.
Common mistakes
- Treating 80 as “sell” and 20 as “buy” in every market condition.
- Changing the settings after each losing trade.
- Using crosses in the middle of the scale.
- Ignoring the higher time frame trend.
- Skipping the stop loss because the oscillator “looks oversold”.
- Comparing a 5, 3, 3 reading on one chart with a 14, 3, 3 reading on another.
- Entering a counter-trend trade on a cross while the higher time frame is still making new highs or lows.
Related indicators: the Ichimoku cloud, trading with the VWAP and the MACD indicator.
Bottom line
The stochastic oscillator tells you where the close sits in the recent range, and nothing more. It is easier to use in a range than in a trend, and its crosses lag. Read it together with price levels and the trend, keep a stop loss on every trade, and risk only money you can afford to lose, because leveraged CFDs can lose value quickly.
Frequently asked questions
What does the stochastic oscillator measure?
It measures where the latest close sits inside the highest-to-lowest range of the last N candles. A reading of 100 means the close is at the top of that range, and 0 means it is at the bottom.
What are the stochastic 80 and 20 levels?
Many platforms draw lines at 80 and 20. Above 80 is often called overbought and below 20 oversold. These labels only say the close is near the edge of the recent range, and price can stay there in a trend.
What is the difference between %K and %D?
%K is the main line calculated from the close and the recent range. %D is a moving average of %K, so it moves more slowly. A cross of %K through %D is the signal many traders watch.
What are the best stochastic settings?
There is no setting that works on every pair. Platform defaults differ (14, 3, 3 and 5, 3, 3 are both common), and shorter settings give more crosses and more false ones. Test any change on a demo account first.
Stochastic or RSI: which is better?
They answer different questions. The RSI compares average gains with average losses, while the stochastic compares the close with the recent range. Neither is a trade signal alone, and many traders use only one to avoid conflicting readings.
How is %D calculated from %K?
%D is a simple moving average of %K, usually over 3 candles. If the last three %K readings are 88, 79 and 64, %D is (88 + 79 + 64) ÷ 3 = 77. %K sits below %D here because it is falling.
Which time frame suits the stochastic?
Higher time frames such as the 1-hour and daily charts give fewer but less noisy readings. On 1-minute and 5-minute charts the line swings across the whole scale on spread and noise, so crosses there mean little.
Does the stochastic work in a strong trend?
It tends to stay above 80 in a strong uptrend or below 20 in a strong downtrend. Selling every reading above 80 in an uptrend is a common way to lose money.