Forex Trend Trading Basics: How to Spot a Trend and Plan the Trade
Trend trading means trading in the direction price has already been moving. A trader buys while a pair keeps making higher highs and higher lows, or sells while it keeps making lower highs and lower lows, and exits when that pattern breaks. The method is simple to describe and hard to do, because trends are clear only in hindsight and most pairs spend a lot of time moving sideways.
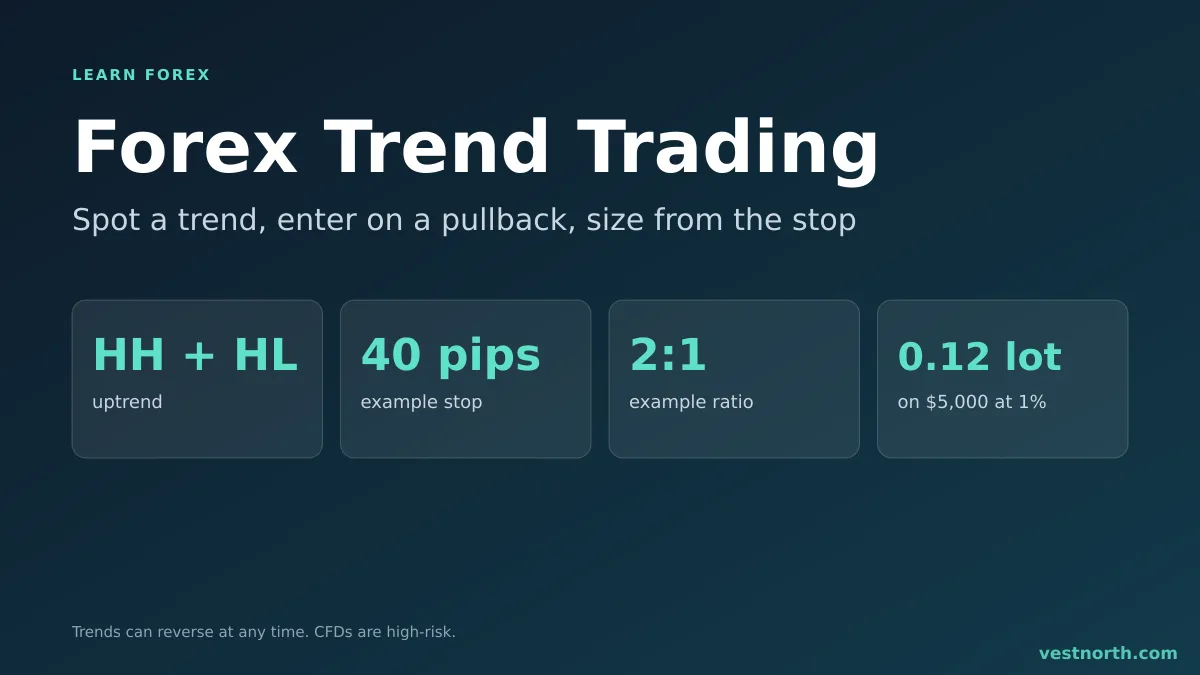
Anatomy of an uptrend trade.
What is a trend?
A trend is a series of swing points: peaks (swing highs) and troughs (swing lows) on the chart.
- Uptrend: each swing high is above the previous one, and each swing low is above the previous one.
- Downtrend: each swing high and each swing low is below the previous one.
- Range: highs and lows overlap, with no clear direction.
A trend is always relative to a time frame. A pair can be in an uptrend on the daily chart and a downtrend on the 15-minute chart at the same time. Decide which time frame you are trading first. For help with candles and time frames, see how to read a forex chart.
Tools that help define a trend
You can see a trend with no indicators. Some traders add one of these to make the call less subjective:
- A trendline: a line joining at least two swing lows in an uptrend (or two swing highs in a downtrend). A third touch makes it more convincing. A close well through the line suggests the trend may be changing.
- A moving average: price staying above a rising average, and the average sloping upward, are read as signs of an uptrend. See moving averages for beginners. All averages lag.
- Higher time frame: a trader on the 1-hour chart may check the daily chart and trade only in the same direction.
Any of these can give a wrong reading near the turn.
Where trend traders enter
There are two common styles, each with a cost.
| Entry | How it works | Cost |
|---|---|---|
| Pullback | Wait for price to dip against the trend and stop, often near a prior level, a trendline or a moving average | Price may not pull back, and you miss the trade |
| Breakout | Enter as price breaks a prior swing high (or low) | Later entry, and a break can fail |
A pullback gives a closer stop and a better ratio, but it also means missing strong trends that never retrace. For the break approach, see what is a forex breakout. Horizontal levels from support and resistance are the usual places to look for a pullback to end.
Where the stop goes
In an uptrend, a common stop sits below the last swing low. If price falls through it, the sequence of higher lows is broken, so the reason for the trade is gone. In a downtrend, the stop goes above the last swing high.
Pick the stop from the chart first. Then work out the lot size from the distance to it, not the other way round. Putting a stop 10 pips away because you want a big lot size puts it inside normal noise. Read what is a stop loss for more on this.
A worked example
Suppose EUR/USD (illustrative prices) is in an uptrend on the 4-hour chart. The last swing low is 1.0860 and price has pulled back to 1.0900, near a prior resistance level that now looks like support.
- Entry: buy at 1.0900.
- Stop loss: 1.0860, just below the swing low. Risk: 40 pips.
- Target: 1.0980, near the previous swing high. Reward: 80 pips.
- Ratio: 2:1 before spread and slippage.
Now size the trade. On a $5,000 account, risking 1% is $50. One pip on a standard lot of EUR/USD is about $10, so a 40-pip stop on 1.00 lot would cost about $400. To risk $50, divide $50 by (40 pips × $10 per lot) = 0.125 lots, which rounds down to 0.12 lots, about $48 of risk. The lot size calculator does this for any pair. The reward at that size is about $96 if the target is hit.
Compare this with risk to reward planning. A 2:1 ratio means a trader can lose more often than they win and still break even. If the win rate is 33%, that is exactly break-even before costs. Spread and slippage push the true figure higher.
Staying in a trend
Entering is half the work. Traders handle the exit in different ways:
- Fixed target, as above.
- Moving the stop up behind each new swing low. A trailing stop can automate this, and it may exit on a normal pullback.
- Closing when the swing pattern breaks, for example when price makes a lower low in an uptrend.
Giving a trend room means accepting that you will give back part of the profit before an exit. Trailing tightly reduces that giveback and also raises the chance of being stopped out early.
Why trend trading is hard
- Sideways markets. Most pairs range for long periods, and a trend strategy is whipsawed in them.
- Late entries. By the time a trend is obvious, a good part of it may be over.
- Reversals. The last pullback in a trend looks the same as the first move of a reversal.
- Discipline. Many traders exit winners too soon and let losers run, the opposite of what the method needs. See forex trading psychology.
- News. A scheduled release can break a trend in seconds. Check the economic calendar.
Common mistakes
- Calling a trend from two candles.
- Trading against the higher time frame with no reason.
- Entering after a long run with the stop far away.
- Using the same lot size regardless of stop distance.
- Moving the stop further from price when the trade goes wrong.
Practise on a demo account. A demo does not reproduce live slippage or spread changes.
Related chart patterns and levels: the head and shoulders pattern, round-number levels and flag and pennant patterns.
Bottom line
A trend is a pattern of higher highs and higher lows, or the reverse. Trend traders join it on a pullback or a break, put the stop where the pattern would fail, and size the lot from that distance. Expect losing streaks, especially when the market goes sideways. Plan each trade on paper first, and risk only money you can afford to lose. CFDs are complex, high-risk instruments.
Frequently asked questions
What is trend trading in forex?
Trend trading means taking positions in the direction price has been moving, for example buying while price makes higher highs and higher lows, and holding until the pattern breaks.
How do I know if a pair is trending?
Look at the swing points. An uptrend shows each high and each low above the one before, and a downtrend shows each lower than the one before. If the highs and lows overlap, the pair is moving sideways.
What is a pullback entry?
A pullback entry means waiting for a temporary move against the trend and entering when it ends, often near a prior level or a rising moving average. The stop can sit beyond the pullback low or high.
Where should a stop loss go in a trend trade?
Common places are below the last swing low in an uptrend and above the last swing high in a downtrend, because a move past it breaks the pattern that defined the trend. The distance then sets your lot size.
Is trend trading profitable?
Nobody can promise that. A trend strategy can lose money for long periods in sideways markets, and many traders lose. Test any approach on a demo account and risk only what you can afford to lose.