How to Read a Forex Chart: A Beginner's Walkthrough
Short answer: A forex chart plots price on the vertical axis and time on the horizontal axis. Each candlestick shows the open, high, low and close for one period, and the time frame sets how long that period is. To read the chart, check the time frame, then the direction of the highs and lows, then the nearby price levels.
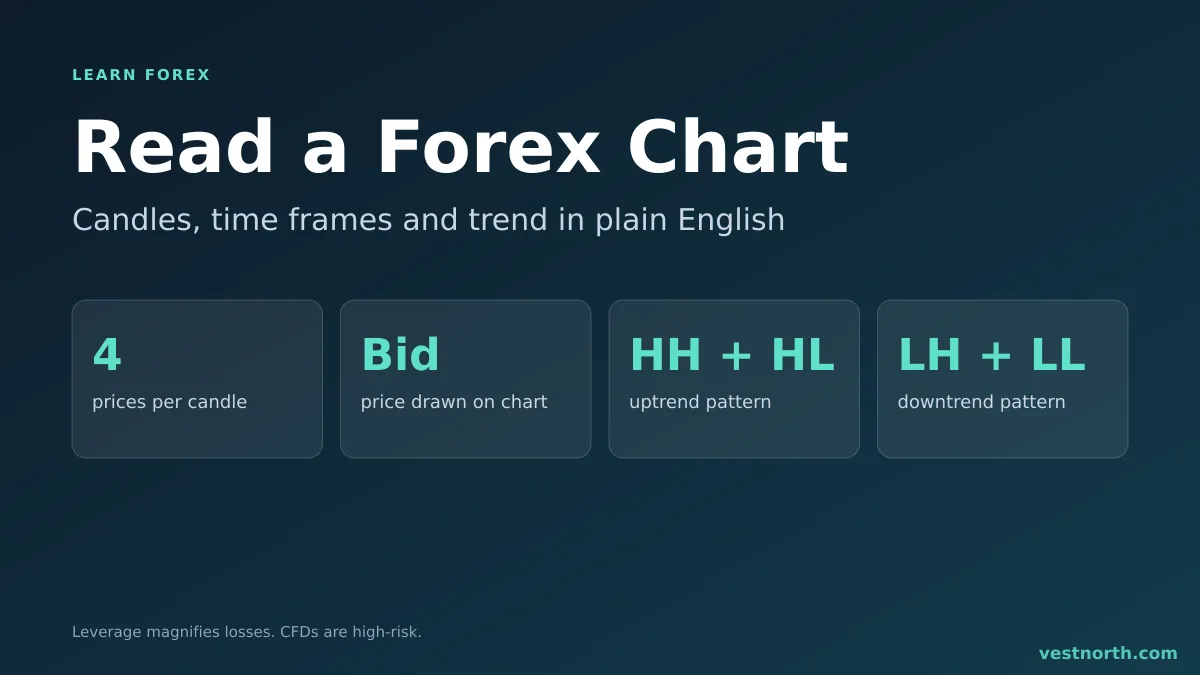
Parts of a forex chart. Illustration, October 2026.
What the axes show
The right-hand scale is the price of the pair, for example 1.0850 on EUR/USD. The bottom scale is time. Prices move left to right, so the newest candle is on the right edge. Pairs are quoted as one unit of the base currency in the second currency, which is why EUR/USD at 1.0850 means 1 euro costs 1.0850 US dollars. See what a currency pair is.
A rising line means the base currency is gaining against the second currency.
How a candlestick works
A candlestick records four prices for one period:
- Open: the first price in the period.
- High: the highest price reached.
- Low: the lowest price reached.
- Close: the last price in the period.
The thick body runs from the open to the close. The thin lines above and below, the wicks or shadows, run to the high and the low. If the close is above the open, the candle is usually drawn in one colour (often green or white). If the close is below the open, it takes the other (often red or black). The colours are a setting, so check your platform.
A long body means the price moved a lot in the period. A long wick means the price went far and was pushed back. A tiny body with wicks on both sides means the open and close were close together. Forex candlestick basics covers common candle shapes in more depth.
Time frames
The time frame is how long each candle lasts. A 1-hour chart draws one candle per hour, and a daily chart one per day. Common choices run from 1 minute to monthly.
The same market looks different on each one. A move that looks like a steep fall on a 5-minute chart can be a small dip on a daily chart. Two habits help:
- Look at a longer time frame first to see the bigger direction, then drop to a shorter one to time an entry.
- Keep to the frame that matches how long you plan to hold, as in scalping vs swing trading.
On longer frames, the time a candle opens and closes depends on your platform’s server time, which can differ from your local time. See forex trading sessions.
Bid, ask and the line on the chart
Most platforms draw the chart from the bid price. You sell at the bid and buy at the ask, which is higher by the spread. So a buy order starts a spread’s distance above the chart price, and a stop loss on a sell can trigger when the ask reaches it, even if the bid line has not touched it yet. Bid and ask price explains the difference. Some platforms let you add an ask line.
Reading the trend
A trend is the general direction of price.
| Pattern | Name | What it describes |
|---|---|---|
| Higher highs and higher lows | Uptrend | Buyers pushed price up in steps |
| Lower highs and lower lows | Downtrend | Sellers pushed price down in steps |
| Highs and lows in a flat band | Range | Neither side is in control |
Trends can end or reverse at any time, and a pattern that looks clean on the chart can fail on the next candle. A trend is a description of what has happened, not a promise of what comes next.
Levels
Prices often react near the same areas. A support level is where price has stopped falling before, and resistance is where it has stopped rising. Marking them takes a ruler tool and a few minutes. Support and resistance shows how to draw them and what a break can mean.
Indicators and chart types
Most platforms also offer line charts, bar charts and a long list of indicators such as moving averages. Line charts show only the close. Bar charts show the same four prices as candles in a different style. Indicators are calculated from past price, so they summarise the chart instead of adding new information. If you add them, add one or two and learn what each calculates.
A five-step routine
- Check the pair and the time frame.
- Look at a longer time frame for the direction.
- Mark the nearest support and resistance.
- Read the last few candles: bodies, wicks, where they closed.
- Decide where an idea would be wrong, which is where the stop loss goes, then size the trade with the lot size calculator.
Practise this on a demo account before using real money.
Bottom line
A chart shows what price has done, in candles of a chosen length. Learn the four prices in a candle, read the trend on a longer time frame, mark the levels and remember that the line is the bid. None of it predicts the next move, so plan the loss before the trade and only risk money you can afford to lose. CFDs are complex, high-risk instruments.
Frequently asked questions
How do you read a candlestick on a forex chart?
Each candle shows four prices for one period: open, high, low and close. The thick body spans the open to the close, and the thin wicks reach the high and the low. Colours show whether the close was above or below the open.
What time frame should a beginner use?
There is no single answer. Shorter frames such as 5 minutes show more noise and need faster decisions, and longer ones such as 4 hours or daily show clearer moves. Many beginners start on the 1-hour or 4-hour chart.
Which price does a forex chart show, bid or ask?
Most platforms draw the chart from the bid price by default. A buy order is filled at the ask, so the real entry is a spread above the line on the chart.
What is a trend on a forex chart?
An uptrend is a series of higher highs and higher lows. A downtrend is lower highs and lower lows. If neither pattern holds, the market is ranging.
Do candle colours mean the same on every platform?
No. Many platforms show green or white for a close above the open and red or black for a close below it, but the colours can be changed in the settings. Check the legend on your platform.
Can I read a chart without indicators?
Yes. Price, time frame and levels such as support and resistance are enough to start. Indicators are calculated from price, so they add a view of it rather than new information.