Forex Candlestick Basics for Beginners
Short answer: A candlestick shows the open, high, low and close of one period. The body is the distance between open and close, and the wicks show how far price went beyond it. Shapes such as the doji, hammer, shooting star and engulfing candle describe who controlled the period, but they predict nothing alone.
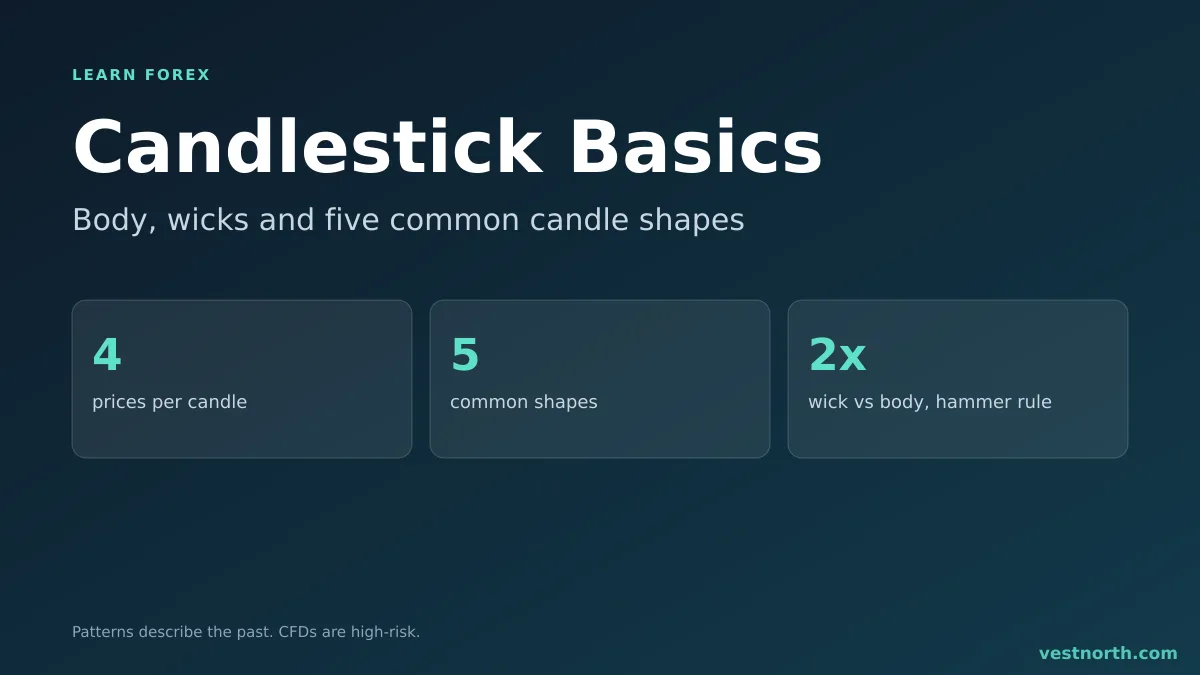
Five common candle shapes. Illustration, October 2026.
Body and wicks
Each candle records four prices: open, high, low and close. The thick body runs between open and close. The thin wicks, also called shadows, run up to the high and down to the low. If you need a refresher on the parts, start with how to read a forex chart.
Three quick readings help with any candle:
- Body size: a large body means price moved a long way from open to close. A small body means it ended close to where it began.
- Wick length: a long wick means price travelled there and was pushed back.
- Position: a body near the top of the candle means the close was near the high. A body near the bottom means the close was near the low.
Colours vary by platform. Many use green or white for a close above the open and red or black for a close below it, but the setting can be changed.
Five candles to know
| Candle | Shape | What it shows |
|---|---|---|
| Marubozu | Large body, little or no wick | Price moved one way for the whole period |
| Doji | Open and close almost equal, wicks on both sides | Neither side finished ahead |
| Hammer | Small body at the top, long lower wick | Price fell, then recovered most of it |
| Shooting star | Small body at the bottom, long upper wick | Price rose, then was pushed back down |
| Engulfing | Body covers the whole previous body | The new period reversed the last one |
Marubozu. A candle with little or no wicks opened near one extreme and closed near the other, so one side held control throughout.
Doji. A doji can appear after a strong move, where it may show hesitation, or in a quiet range, where it means little. A doji with long wicks on both sides shows a volatile period that ended where it began.
Hammer and shooting star. They are mirror images. A hammer after a fall has a long lower wick, so sellers pushed price down and buyers took it back. A shooting star after a rise has a long upper wick, so buyers pushed up and sellers took it back. Traders often call the same shape a pin bar. The rule of thumb most use is a wick at least twice the body, but the exact ratio is a convention, not a law.
Engulfing. A bullish engulfing candle follows a down candle and closes higher, with a body that covers the previous one. A bearish engulfing candle is the reverse. It needs two candles to read.
Context decides
The same shape means different things in different places. A hammer at a known support level gives a trader a reason to look at a buy and a clear place for a stop, just below the hammer’s low. A hammer in the middle of a range has no level behind it.
Questions worth asking before acting on any candle:
- Where is it? Is it at a level you marked, or in empty space?
- What time frame is it on? A pattern on a daily chart covers a full day of trading, while the same shape on a 1-minute chart can be a few seconds of noise.
- Did a news release cause it? See the economic calendar guide.
- Where would the idea be wrong?
Waiting for the close
A candle is not finished until its period ends. A hammer shape forming on a 4-hour chart can turn into a different candle before the close, because the high, low and close keep changing. Traders who act on a pattern usually wait for the close. The close time depends on your platform’s server time, which may differ from your local time. See forex trading sessions.
What patterns cannot do
Candle patterns are descriptions of the past. They do not carry a stated success rate you can rely on, and results published for them vary with the pairs, the period and the rules used. Treat any claim of a fixed win rate with caution.
A pattern also does not change risk. If you enter on a hammer with a stop 25 pips away, you lose 25 pips if the stop is hit, however clean the candle looked. Size the position from the stop distance. The lot size calculator and the pip calculator turn pips into money.
A short example
EUR/USD falls to 1.0850, a level where it stopped twice last week. The 4-hour candle opens at 1.0865, drops to 1.0838, then closes at 1.0862. The body is 3 pips and the lower wick is 24 pips: a hammer shape, at a level.
A trader who takes it might buy after the close with a stop at 1.0834, just under the low, which is about 28 pips from an entry at 1.0862. If the next candle closes below 1.0834, the idea has failed and the loss is taken. Nothing in the hammer said the next candle would rise.
Practise reading candles on a demo account before risking real money.
Related candlestick patterns: three white soldiers and three black crows, the marubozu candle and tweezer tops and bottoms.
Bottom line
Learn to read the body, the wicks and where the close sits. Know the five shapes, but use them only with a level and a stop loss. A pattern is evidence of what happened, and it is not a signal that works every time. Only trade amounts you can afford to lose, because CFDs are complex, high-risk instruments.
Frequently asked questions
What is a candlestick in forex?
A candlestick is one bar on a price chart. Its body spans the open to the close of a period, and its wicks reach the high and the low of that period.
What does a doji candle mean?
A doji has an open and a close at almost the same price, so it has a very small body. It shows that neither buyers nor sellers finished ahead in that period. Its meaning depends on where it appears.
What is a hammer candle?
A hammer has a small body near the top and a long lower wick, often at least twice the body. It shows price fell and was pushed back up. It is usually read as a possible pause after a fall, not a guarantee of a rise.
What is a bullish engulfing candle?
It is a candle whose body is larger than the previous candle's body and covers it completely, closing higher after a down candle. Traders read it as buyers taking over, but it can fail.
Do candlestick patterns predict the market?
No. They describe what price did in a period. A pattern is more useful near a known support or resistance level, with a stop loss placed where the idea would be wrong.
Which time frame is best for candlestick patterns?
Patterns on longer time frames such as 4-hour or daily cover more trading and often have less noise. On very short frames, random moves can produce the same shapes more often.