What Are Tweezer Tops and Tweezer Bottoms in Forex? How to Spot Them and Place a Stop
Short answer: A tweezer top is two candles at the end of a rise with almost the same high. A tweezer bottom is two candles at the end of a fall with almost the same low. Both suggest price was rejected twice at the same level. They are possible reversal clues, not guarantees, and they matter most at support or resistance.
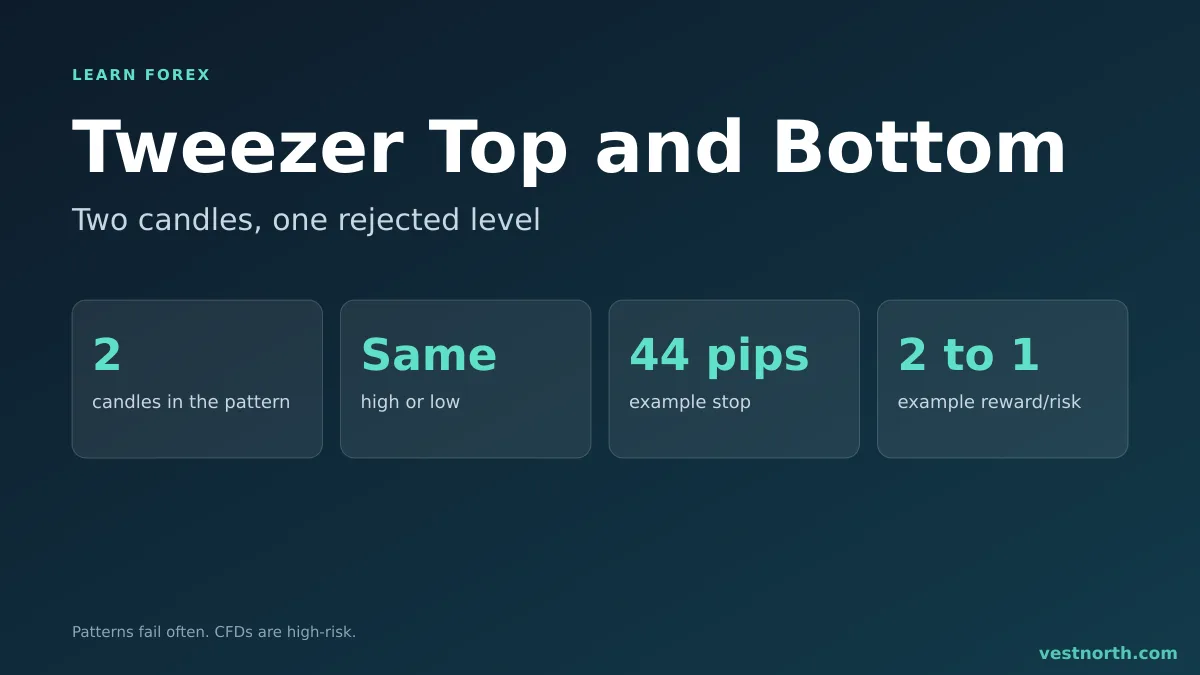
Tweezer top and tweezer bottom. Illustration, October 2026.
What the patterns look like
Both patterns use two candles side by side.
- Tweezer top. Price has been rising. The first candle is usually bullish, the second bearish, and both reach almost the same high.
- Tweezer bottom. Price has been falling. The first candle is usually bearish, the second bullish, and both reach almost the same low.
The name comes from the shape: the matching highs or lows look like the tips of tweezers. If you are new to reading candles, start with candlestick basics.
What the pattern says about buyers and sellers
In a tweezer top, buyers pushed price up to a level on the first candle. On the second candle, they tried again and failed at the same price, and sellers closed the candle lower. Two attempts, one ceiling. That ceiling is the information.
A tweezer bottom reads the same way in reverse: sellers tried twice to break a floor and could not.
Because the matching level is the key, the pattern is more useful when it sits on a known support or resistance level, a supply or demand zone or a recent swing high or low.
How close is “matching”?
The highs or lows do not need to be identical. A gap of one or two pips on EUR/USD may count, while the same gap on a volatile pair on a 15-minute chart may be meaningless. Choose a rule and keep it, for example “within 10% of the average candle size”. The ATR gives you a feel for normal movement on that pair and time frame. This is a convention, not an official definition.
Tweezers vs similar candles
| Pattern | Candles | What it shows |
|---|---|---|
| Tweezer top / bottom | 2, matching high or low | Same level rejected twice |
| Engulfing candle | 2, second covers the first | Control changes hands |
| Inside bar | 2, second inside the first | Pause |
| Pin bar | 1, long tail | Rejection with a single candle |
How to trade a tweezer pattern
There is no single correct method. This is a common outline for a tweezer top, and a tweezer bottom is the mirror image:
- Context. Price has risen into resistance or the end of a pullback in a downtrend.
- Pattern. Two candles with matching highs, the second closing lower.
- Entry. Sell after the second candle closes, or wait for the next candle to trade below its low.
- Stop. Just above the shared high, plus a buffer for the spread.
- Target. The next support level or a multiple of the risk. See the risk-reward ratio.
Worked example
On a 4-hour GBP/USD chart, price rises into resistance near 1.2750. One candle reaches 1.2752 and closes bullish. The next reaches 1.2750, then closes bearish at 1.2718. The figures are illustrative.
| Item | Level | Distance |
|---|---|---|
| Entry (close of second candle) | 1.2718 | |
| Stop (above shared high) | 1.2762 | 44 pips |
| Target | 1.2630 | 88 pips |
| Reward to risk | 2 to 1 |
With a 2,000 USD account risking 1% (20 USD), a 44-pip stop calls for about 0.45 USD per pip, which is roughly 0.045 lots on a pair where a standard lot is worth 10 USD per pip. Use the lot size calculator and read position sizing for the method. If the stop is too wide for your risk limit, skipping the trade is a valid choice.
Why tweezers fail
- No level. Two matching highs in the middle of a range say little.
- Strong trend. In a strong trend, a pause at a high is often followed by a continuation. See trend trading.
- News. A release can create a high that reflects the event, not market structure. Check the economic calendar.
- Hindsight. Charts show the tweezers that worked. The failures are easy to skip when you look back. A fakeout can also push price through the level and then reverse again.
- Tiny candles. On a quiet chart, two small candles with equal highs are mostly spread noise.
Using a tweezer with other tools
Traders often want a second reason: a moving average, an RSI reading at an extreme, or agreement from a higher time frame (see multiple time frames). More conditions mean fewer trades, and fewer is not automatically better. Test your combination on a demo account and log every result.
Bottom line
A tweezer top has two candles with matching highs after a rise, and a tweezer bottom has two with matching lows after a fall. They show the same level rejected twice, which is useful mostly at a known support or resistance. Put the stop just beyond the shared high or low, size the trade from that distance and expect failures. Only risk money you can afford to lose. CFDs are complex, high-risk instruments.
Frequently asked questions
What is a tweezer top in forex?
A tweezer top is a two-candle pattern near the end of a rise where both candles reach almost the same high. It suggests buyers failed twice at the same price and may be losing control.
What is a tweezer bottom?
A tweezer bottom is the mirror image after a fall. Two candles reach almost the same low, which suggests sellers failed twice at that price.
Do the two candles have to match exactly?
No. Highs or lows within a few pips of each other are usually accepted. What counts as close depends on the pair and the time frame, so use a consistent rule.
Does the colour of the candles matter?
Many traders prefer a bullish candle followed by a bearish one for a tweezer top, and the reverse for a tweezer bottom, because it shows the change in control. The location matters more than the colours.
Where does the stop loss go on a tweezer trade?
Usually just beyond the shared high for a tweezer top, or just beyond the shared low for a tweezer bottom. A break of that level means the rejection failed.
How reliable is a tweezer pattern?
We have no verified statistic for how often tweezers lead to a reversal. Treat any success rate quoted online with care and test the pattern on a demo account.