Forex Supply and Demand Zones: How to Draw and Use Them
Short answer: A supply zone is a price area where a sharp move down began, and a demand zone is an area where a sharp move up began. Traders draw them as boxes, not single lines, and watch what price does if it returns. A zone is a reference area, not a promise: price can pass through it, so every trade needs a stop loss.
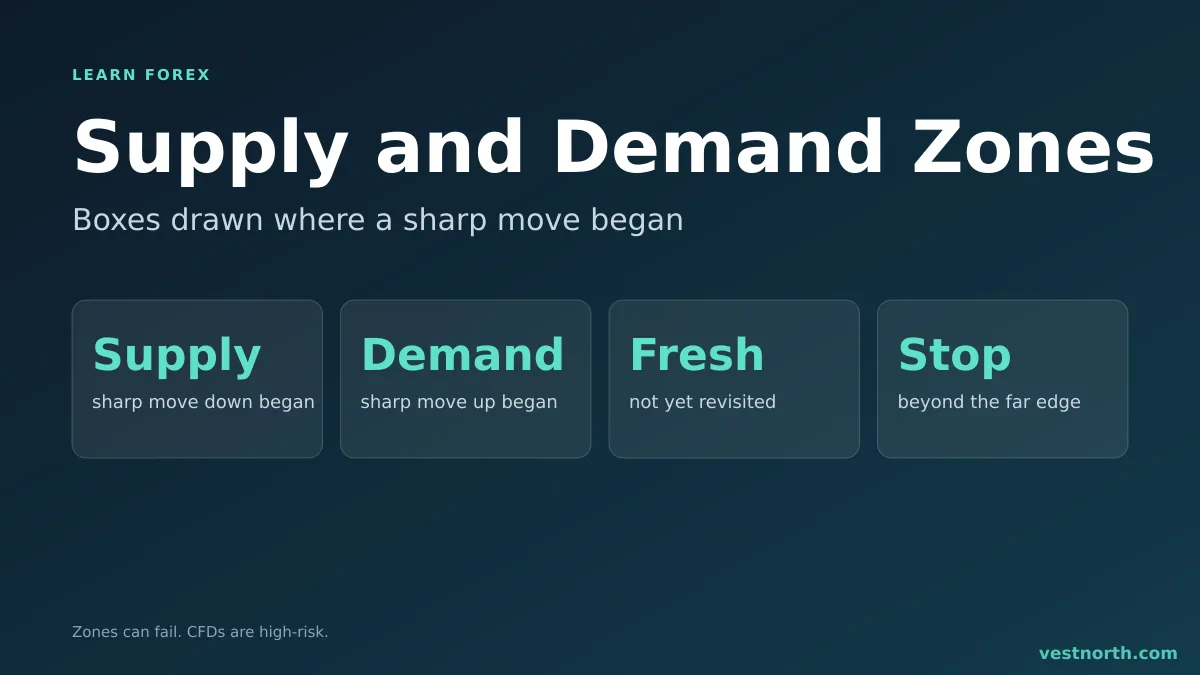
A demand zone under a sharp rally and a supply zone above a sharp drop. Illustration, October 2026.
The idea behind the zones
When price leaves an area quickly, traders conclude that one side was much stronger there. If price rockets up from 1.0800, buying was strong around 1.0800. The method assumes some of that interest has not been fully used, so a return to the area may bring a reaction.
That is a theory about order flow, and retail traders cannot see the orders of banks or funds. Zones are a way of organising a chart, and they have not been shown to work on every pair or period. Treat them as one tool for planning where to place trades.
How to find a zone
- Find a sharp move. Look for a strong run of candles in one direction, with large bodies and little overlap.
- Find where it started. Go back to the small candles (the base) just before the move.
- Draw a box. The top and bottom of the box cover the base candles. Some traders include the wicks, others use only the bodies. Pick one rule and keep it.
- Extend the box to the right. It stays on the chart until price comes back.
A worked example with invented prices. EUR/USD sits between 1.0800 and 1.0815 for a few candles, then rises to 1.0900 within hours. The demand zone is the box from 1.0800 to 1.0815, a height of 15 pips. If price falls back to 1.0815 two days later, the trader watches for a reaction, with a stop loss placed under the box at, say, 1.0790.
Supply, demand and the four base patterns
Traders often name the pattern by how price moved into and out of the base.
| Pattern | Move into the base | Move out of the base | Zone type |
|---|---|---|---|
| Rally-base-rally | Up | Up | Demand (continuation) |
| Drop-base-rally | Down | Up | Demand (reversal) |
| Drop-base-drop | Down | Down | Supply (continuation) |
| Rally-base-drop | Up | Down | Supply (reversal) |
The names are for communication. What matters in practice is the strength of the move away from the box and the direction of the larger trend.
Fresh, tested and broken zones
- Fresh: price has not returned to the box. Many traders prefer these.
- Tested: price returned and reacted. Some traders think each test uses up interest in the zone, while others see a held zone as confirmed.
- Broken: price closed clearly through the box. The zone is no longer valid, and some traders flip it, so a broken demand zone is watched as new supply.
These are conventions, not laws. If you backtest the idea, count the zones that failed along with the ones that worked.
Zones vs support and resistance
The two ideas overlap. A line of support and resistance is usually drawn on a level that price touched several times. A zone is drawn from one decisive move, so it can exist after a single turn. Zones are also wider, which suits the way price tends to react to an area, not an exact figure. Lines suit clean, repeated levels, and zones suit areas that are still untested. Neither is better.
Using a zone in a trade plan
A simple structure, with a demo account for practice:
- Direction: check the trend on a higher time frame. A demand zone inside an uptrend is a cleaner idea than one against it.
- Entry: wait for the price to reach the zone, then look for a sign of a reaction on a lower time frame, such as a candlestick turning back out of the box. Entering with a limit order at the edge is possible but carries more risk if the zone fails.
- Stop loss: beyond the far edge of the box, with a gap for the spread. See what is a stop loss.
- Target: the nearest opposing zone or level, which lets you measure the risk-reward ratio before you enter. If the target is closer than the stop, skip the trade.
Take the demand zone above: entry at 1.0815, stop at 1.0790 (25 pips), target at 1.0900 (85 pips). The ratio is 85 ÷ 25 = 3.4 to 1. That is arithmetic on invented prices. Many zone trades lose, so the ratio only helps if you keep the losses small.
Limits of the method
- Subjective drawing. Two traders draw different boxes on the same chart. Hindsight also makes it easy to find “perfect” zones on old charts.
- Too many zones. A busy chart has a zone everywhere, and any reaction can be explained afterwards.
- Breakouts and fakeouts. Price may spike through a zone and return, which is the pattern in our fakeout guide, or stay beyond it, as in a breakout.
- News. Data releases can send price through a zone in seconds, and slippage can fill a stop at a worse price.
Common mistakes
- Drawing zones on a 5-minute chart and trading them with a wide spread.
- Entering at the first touch with no sign of a reaction.
- Moving the stop loss further away once price is inside the zone.
- Keeping broken zones on the chart.
- Risking too much per trade because the zone “looks strong”. The position sizing guide shows how to cap the loss.
Bottom line
Supply and demand zones are boxes drawn around the base of a sharp move, used to plan where to watch for a reaction. They are subjective and can fail, so draw them on higher time frames, check the trend, set a stop loss beyond the box and measure the risk-reward before entering. Practise on a demo account first, and only risk money you can afford to lose.
Frequently asked questions
What is a supply zone in forex?
A supply zone is a price area where a strong move down started. Traders mark it because sellers were active there, and some expect selling interest if price returns to the area. There is no guarantee that it will hold.
What is a demand zone in forex?
A demand zone is a price area where a strong move up started. Traders mark it as a place where buyers were active, and watch for a reaction if price comes back.
How is a zone different from support and resistance?
Support and resistance are usually drawn as lines at levels where price turned several times. Zones are drawn as boxes around the candles that started a sharp move, and often come from a single turn.
What is a fresh zone?
A fresh zone is one that price has not returned to since it formed. Many traders prefer fresh zones and treat each retest as weakening the zone. This is a rule of thumb, and no test has shown that it works on every pair.
Which time frame should I use to draw zones?
Draw zones on a higher time frame such as the 4-hour or daily chart, then look for entries on a lower one. Zones from low time frames are small and are easily broken by the spread and noise.
Do supply and demand zones always work?
No. Price can run straight through a zone, and news can break any level. Place a stop loss beyond the zone and size the trade so that a loss is acceptable.