What Is a Fakeout in Forex Trading?
Short answer: A fakeout is a move through a support or resistance level that fails and closes back inside the range. It is the same event as a false breakout. Nobody can tell a fakeout from a real breakout at the moment of the break, so the protection is a stop loss set before entry and a lot size that keeps the loss small.
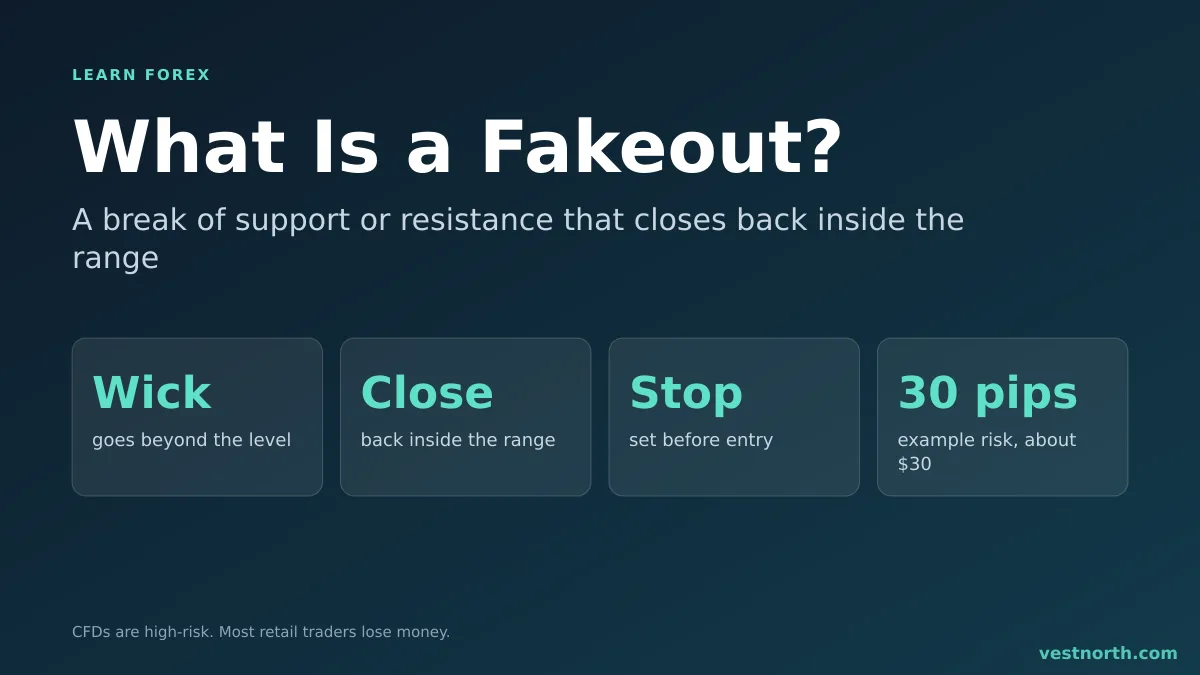
A fakeout above resistance, with the wick, the close back inside the range and a stop above the high. Illustration, October 2026.
What a fakeout looks like on a chart
Start with a level that price has respected before. Price then moves beyond it, so traders watching for a breakout buy or sell. Within a few candles price comes back, and the candle that finishes the move closes on the original side of the level.
On the chart the clearest sign is a long wick. The wick marks how far price travelled beyond the level, and the body shows where the candle finished. A tall wick above resistance with a body back under it means buyers pushed price up and were then overpowered. Forex candlestick basics explains how to read wicks and bodies.
Why fakeouts happen
No one source explains every case. These are the usual reasons traders give:
- Stop orders clustered at the level. Many traders place stops just beyond an obvious high or low. A brief push through can trigger them, and the orders they create add to the spike.
- News. A scheduled release can move price through a level in seconds, and the first reaction is sometimes reversed. See the economic calendar guide.
- Thin trading. In a quiet part of the day, a few large orders can move price further than usual. Forex trading sessions shows when liquidity is lower.
- A weak level. A level touched only once is not much of a level.
Signs a break may fail
Treat these as reasons to look closer, not as signals:
- The breakout candle has a long wick and a small body.
- The next candle returns inside the range and closes there.
- The break happens a few minutes before a major release.
- Price breaks out of a long, tight range with no sign of a bigger move on higher time frames.
A worked example
This is a made-up case to show the arithmetic. GBP/USD has stopped at 1.2800 three times. A candle spikes to 1.2815, then closes at 1.2790, back under the level.
| Trader | Entry | Stop loss | Risk |
|---|---|---|---|
| Buyer of the break | Buy at 1.2805 | 1.2775 | 30 pips |
| Seller after the failed break | Sell at 1.2790 | 1.2825, above the wick high | 35 pips |
On a 0.10 lot, one pip of a USD-quoted pair is worth about $1. The buyer’s stop is hit when price falls to 1.2775, a loss of about $30 plus spread and any slippage. The seller risks about $35. If the seller aims for 1.2720, 70 pips away, the reward is about $70, which is 2:1 before costs.
If price instead closes at 1.2830, the seller’s stop is hit. Both outcomes are possible each time, and the stop is what keeps one wrong trade small. The lot size calculator turns a stop distance into a lot size, and the pip calculator gives the pip value for other pairs.
Ways to reduce the damage
- Wait for a close. A candle that finishes beyond the level is stronger evidence than a wick. You enter later and give up part of the move.
- Wait for a retest. Some traders only enter when price returns to the broken level and holds. The retest may not happen.
- Keep the stop where the idea fails. For a long breakout trade that is back inside the range. Moving it further away after entry turns a small loss into a large one.
- Skip trades around major news. The calendar lists the times.
- Mind the fill. A stop or pending order can fill several pips away from the price you chose when the market moves fast. Slippage explains why.
Common mistakes
- Treating every wick through a level as a signal.
- Entering with no stop, or deleting the stop when price turns.
- Trading the same size on a 15-pip stop and a 60-pip stop.
- Assuming a fakeout trade is safer than a breakout trade. It has its own failure case, which is a real breakout.
Practise on a demo account before using money. A demo does not reproduce real-market slippage, so live fills can differ.
Related chart patterns and levels: the cup and handle pattern and mean reversion trading. Related candlestick patterns: the harami pattern.
Bottom line
A fakeout is a break that failed, and you only know that after the candle closes. Mark the level, decide whether you need a close beyond it, place the stop where the idea is wrong and size the lot from that distance. Some trades will fail whichever way you enter. Risk only money you can afford to lose. CFDs are complex, high-risk instruments.
Frequently asked questions
What is a fakeout in forex?
A fakeout is a move through a support or resistance level that fails. Price goes beyond the level, then returns and closes back inside the old range. The term is used for the same event as a false breakout.
How is a fakeout different from a real breakout?
The difference is only known afterwards. A real breakout holds beyond the level, and a fakeout returns inside it. At the moment of the break the two look the same, which is why a stop loss is set before entry.
How can you spot a possible fakeout?
Warning signs include a long wick beyond the level with a candle body that closes inside it, a break during a quiet session, and a break just before scheduled news. None of them is reliable on its own.
Can you trade a fakeout?
Some traders enter against the failed break once a candle closes back inside the range, with a stop above the wick high. It is a trade with a defined risk, and it can fail like any other.
Where should the stop loss go on a fakeout trade?
A common place is just beyond the extreme of the failed move, because a new high or low beyond that point would show the idea was wrong. Size the lot so the distance matches an amount you accept losing.
Do fakeouts happen at news releases?
They can. Prices often move sharply on scheduled news and then reverse within minutes, and spreads may widen at the same time. Check the economic calendar before trading near a level.