Harami Candle Pattern in Forex: How to Read Bullish and Bearish Harami
Short answer: A harami is a two-candle pattern: a large candle followed by a small candle whose body sits inside the body of the first. It shows that momentum has slowed. After a decline it is called a bullish harami, and after a rise a bearish harami. It is a weak signal on its own and works best at a support or resistance level with a confirming candle.
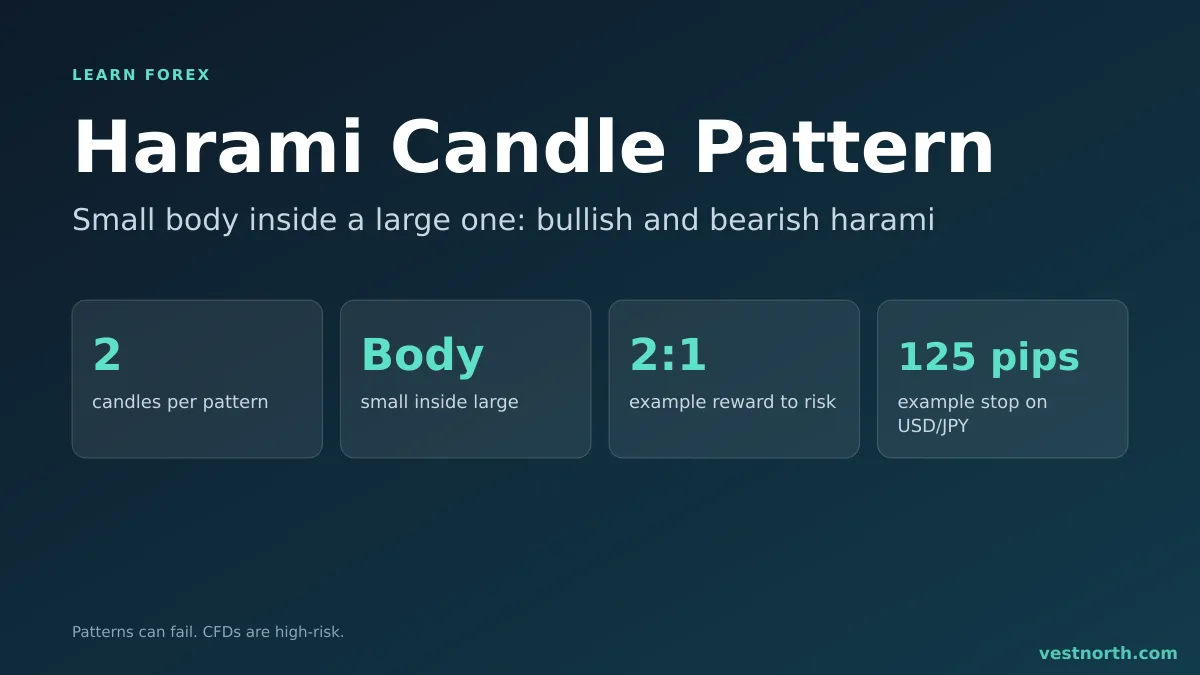
Bullish and bearish harami. Illustration, November 2026.
What a harami looks like
The word harami comes from Japanese and is commonly translated as “pregnant”. The large candle is the mother, and the small candle is held inside her body.
There are two parts:
- A large-bodied candle that continues the current move.
- A small-bodied candle whose body sits inside the first candle’s body. The second candle can be either colour. If it is a doji, the pattern is called a harami cross.
Only the bodies are compared. The small candle’s wicks may go above or below the first body, and many definitions even allow them to poke past the first candle’s wicks.
Bullish and bearish harami
| Feature | Bullish harami | Bearish harami |
|---|---|---|
| Comes after | A decline | A rise |
| Candle 1 | Large bearish | Large bullish |
| Candle 2 | Small body inside candle 1’s body | Small body inside candle 1’s body |
| Read as | Selling pressure fading | Buying pressure fading |
| Possible outcome | Bounce or pause | Pullback or pause |
The harami is a pause pattern. After a strong candle, the next session cannot extend the move, and the range shrinks. That tells you the push has lost energy. It does not tell you that the other side has taken over. This is the main difference from an engulfing candle, where the second candle is larger than the first and shows the opposite side winning.
Harami vs inside bar
The two are close relatives with one difference.
| Harami | Inside bar | |
|---|---|---|
| What must stay inside | The body of candle 2 inside the body of candle 1 | The whole range (high and low) of candle 2 inside candle 1’s range |
| Strictness | Looser | Stricter |
| Typical use | Reversal or slowdown clue | Breakout setup either side |
Every inside bar is roughly a harami, but a harami can have wicks that break the first candle’s range. For more on the shape of candles, see candlestick basics.
How to trade a harami
There is no single correct method. A common outline for a bullish harami:
- Context. A decline into a support level, or a pullback inside an uptrend.
- Pattern. The large bearish candle and the small candle have both closed.
- Confirmation. Wait for a third candle that closes above the high of the harami pattern. The confirmation matters more here than for other patterns because the harami alone shows hesitation, not a turn.
- Entry. Buy above the high of the two-candle pattern, or on the close of the confirming candle.
- Stop. Below the low of the pattern, plus a buffer for the spread.
- Target. The next resistance level, or a multiple of the risk. See the risk-reward ratio.
For a bearish harami, reverse every step.
Worked example (illustrative figures)
On a daily USD/JPY chart, price rises to a resistance zone near 152.00. Candle 1 is a large bullish candle: open 150.60, close 151.90, high 152.05. Candle 2 opens at 151.70 and closes at 151.30, with a high of 151.95 and a low of 151.10. Its body (151.30 to 151.70) sits inside candle 1’s body (150.60 to 151.90).
The next day closes at 150.85, below candle 2’s low.
| Item | Level | Distance |
|---|---|---|
| Entry (confirming close) | 150.85 | |
| Stop (above pattern high 152.05, plus 0.05) | 152.10 | 125 pips |
| Target | 148.35 | 250 pips |
| Reward to risk | 2 to 1 |
The stop is wide because the pattern is on a daily chart. On a USD account risking 1% of 5,000 USD (50 USD), a 125-pip stop means about 0.40 USD per pip on a yen pair, and the pip value guide shows how to convert it. If the distance is too wide for your plan, move to a lower timeframe or skip the trade. See position sizing for the method.
Why harami patterns fail
- Hesitation is not reversal. The small candle may be a rest before the trend resumes.
- No level. A harami in open space is easy to find and easy to lose money on.
- Tiny candles. If candle 1 is not large relative to recent candles, the pattern is just noise.
- News. A quiet candle before a data release does not mean sellers or buyers have gone. Check the economic calendar.
- Hindsight. Charts show the haramis that worked. We have no verified statistic for how often they lead to a reversal, so be careful with numbers you read online.
Bottom line
A harami is a small candle held inside the body of a large one, a sign that momentum has slowed. It is a weaker clue than an engulfing candle, so wait for confirmation and look for a nearby support or resistance level. Place the stop beyond the pattern and size the position from that distance. Test the pattern on a demo account first. Only risk money you can afford to lose. CFDs are complex, high-risk instruments.
Frequently asked questions
What is a harami candle?
A harami is a two-candle pattern. The first candle has a large body, and the second has a small body that sits entirely inside the first candle's body. It shows momentum slowing and is a possible warning of a pause or reversal.
What does harami mean?
The word comes from Japanese and is commonly translated as pregnant. The large first candle is the mother and the small second candle sits inside it.
What is the difference between a bullish and a bearish harami?
A bullish harami follows a decline: a large bearish candle, then a small candle inside its body. A bearish harami follows a rise: a large bullish candle, then a small candle inside its body.
Is a harami the same as an inside bar?
Not exactly. A harami compares bodies only, so the second candle's wicks can poke out of the first candle. An inside bar must stay inside the whole range, wicks included, of the previous candle.
Is a harami a strong signal?
It is generally treated as a weak signal that shows hesitation. Most traders wait for the next candle to confirm direction and want a nearby support or resistance level.
Where does the stop loss go on a harami trade?
Usually beyond the extreme of the large first candle, or beyond the harami candle for a tighter stop. The tighter stop means more stop-outs, so test both on a demo account.