Forex Mean Reversion Trading: How It Works, Tools Used and Where It Fails
Short answer: Mean reversion is the idea that price, after stretching far from its average, tends to move back toward it. A trader sells when price looks stretched high and buys when it looks stretched low, aiming for a return to the average, such as a moving average or the middle of a range. It suits range-bound markets and often fails in strong trends, where stretched prices keep stretching. The main risk is the stop: a few small wins can be erased by one trade that runs against you.
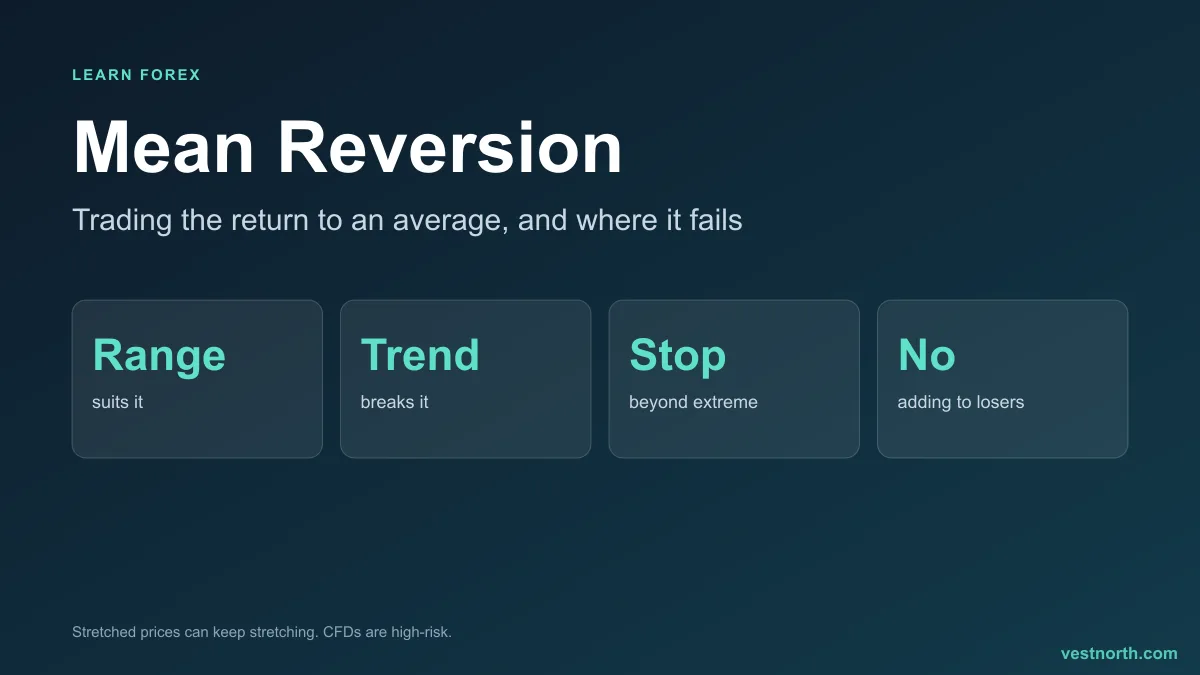
Mean reversion in one picture. Illustration, November 2026.
The idea behind mean reversion
Prices move around an average. A sharp move away from that average, caused by a news spike or a burst of buying, is often followed by a partial move back. Mean reversion traders try to act on the move back.
What counts as “the mean” is a choice, not a fact. Common choices:
- A moving average, such as the 20-period average.
- The middle line of Bollinger Bands.
- The middle of a range between support and resistance.
- A pivot point.
The mean also moves. In a rising market the 20-period average climbs, so a “return to the mean” can happen with price barely falling.
Mean reversion vs trend following
| Mean reversion | Trend following | |
|---|---|---|
| Buys | Weakness, after a fall | Strength, after a rise |
| Sells | Strength, after a rise | Weakness, after a fall |
| Best market | Range, low trend strength | Clear trend |
| Typical win | Smaller, more often | Larger, less often |
| Typical risk | One big loss when a trend starts | Many small losses in a range |
The last row is the usual trade-off, though it varies by trader and rules. Neither approach wins in every market, which is why checking the market type matters more than the tool.
Tools used to find stretched prices
- Bollinger Bands. A close outside the outer band marks a stretched price relative to recent volatility. In a trend, price can walk along the band for many candles.
- RSI. Readings above 70 or below 30 are labelled overbought and oversold. These labels describe momentum, not a forecast. See the RSI indicator.
- Stochastic oscillator. Works in a similar way to the RSI. See the stochastic oscillator.
- Distance from the average. Some traders measure how many pips price sits from the 20-period average and compare it with past stretches.
A single stretched reading is weak evidence. Many traders wait for a rejection candle, such as a pin bar, before acting.
First check: is the market ranging?
Mean reversion works only if there is something to revert to. Before trading it, check:
- Do the last several swing highs and lows sit at about the same levels?
- Is the moving average roughly flat?
- Is trend strength low? A reading below about 20 on the ADX is a common sign of a weak trend, though the threshold is a convention and not a rule.
- Is a major news release due? Data can start a trend within minutes. See the economic calendar.
If the answer to the first three is no, the market is probably trending and mean reversion trades are likely to fight it.
Worked example (illustrative figures)
On a 1-hour EUR/GBP chart, price has moved sideways between 0.8450 and 0.8520 for two days. The 20-period average sits near 0.8485. Price spikes to 0.8522, closes back inside the range with a long upper wick, and RSI reads 74.
| Item | Level | Distance |
|---|---|---|
| Entry (sell below the rejection candle low) | 0.8515 | |
| Stop (above the spike high, plus spread) | 0.8528 | 13 pips |
| Target (the 20-period average) | 0.8485 | 30 pips |
| Reward to risk | about 2.3 to 1 |
With a 3,000 USD account risking 1% (30 USD), a 13-pip stop allows about 2.31 USD per pip. EUR/GBP pip values depend on the account currency, so use the pip calculator and lot size calculator for exact numbers. The levels are made up for the example and are not a signal.
The stop here is small because the range gives a clear place where the idea is wrong: above the spike high. If a stop would have to be wider than your risk limit allows, skip the trade.
Why mean reversion fails
- The trend starts. A breakout from a range turns a stretched price into the start of a move. See breakouts.
- Averaging down. Adding to a losing trade because price is “even more stretched” is how small losses become large ones. Decide the stop before entry and keep it.
- Wrong mean. Different averages and periods give different targets, and picking one after the fact is hindsight.
- Costs. Small targets are sensitive to the spread. A 30-pip target with a 2-pip spread gives up about 7% of the move to costs.
- News. Releases can break a range in seconds. Many traders stand aside before high-impact events.
Rules that keep the risk limited
- A stop loss on every trade, placed beyond the extreme, never moved further away.
- Risk a small, fixed percentage per trade. See risk per trade and position sizing.
- No adding to a loser.
- Stop trading the idea if the range breaks and the average starts to slope.
- Test on a demo account and record every trade in a journal.
Bottom line
Mean reversion bets that a stretched price will return toward an average. It fits ranges and works badly in strong trends, so check the market type first. Use a rejection candle or level as a second reason, put the stop beyond the extreme and size the position from it. Do not add to losers. Only risk money you can afford to lose. CFDs are complex, high-risk instruments.
Frequently asked questions
What is mean reversion in forex?
Mean reversion is the idea that after price moves far from its average, it tends to move back toward it. Traders use it to sell after a sharp rise and buy after a sharp fall, usually inside a range.
What indicators are used for mean reversion?
Common ones are Bollinger Bands, the RSI and the stochastic oscillator for stretched readings, and a moving average as the mean to return to. No indicator proves that price will revert.
Does mean reversion work in forex?
It can work in range-bound markets and fails in strong trends. We have no verified statistic for how often it works, so treat claims about success rates carefully and test the rules yourself on a demo account.
What is the difference between mean reversion and trend following?
Trend following buys strength and sells weakness, expecting a move to continue. Mean reversion sells strength and buys weakness, expecting it to fade. They need opposite market conditions.
Why is mean reversion risky?
Price can stay stretched or keep going, and the loss on a trade against a strong trend can be much larger than the typical win. A fixed stop loss and small position size are what keep that loss limited.
Is an overbought RSI a sell signal?
Not by itself. In a strong trend the RSI can stay above 70 for many candles. Mean reversion traders usually combine it with a range, a level or a rejection candle.
How do I know if the market is ranging or trending?
Look for flat highs and lows and a flat moving average, or use a trend-strength tool such as the ADX. A low reading suggests a weak trend, which suits mean reversion better.