ADX Indicator in Forex: How to Read Trend Strength, +DI and -DI
Short answer: The ADX (Average Directional Index) measures how strong a trend is on a 0 to 100 scale. It does not say whether the trend is up or down. Most platforms start with a 14-period setting. Many traders read a value below about 20 as a weak trend or a range and above about 25 as a trend, but these are conventions, not rules. The ADX lags, so it confirms rather than predicts.
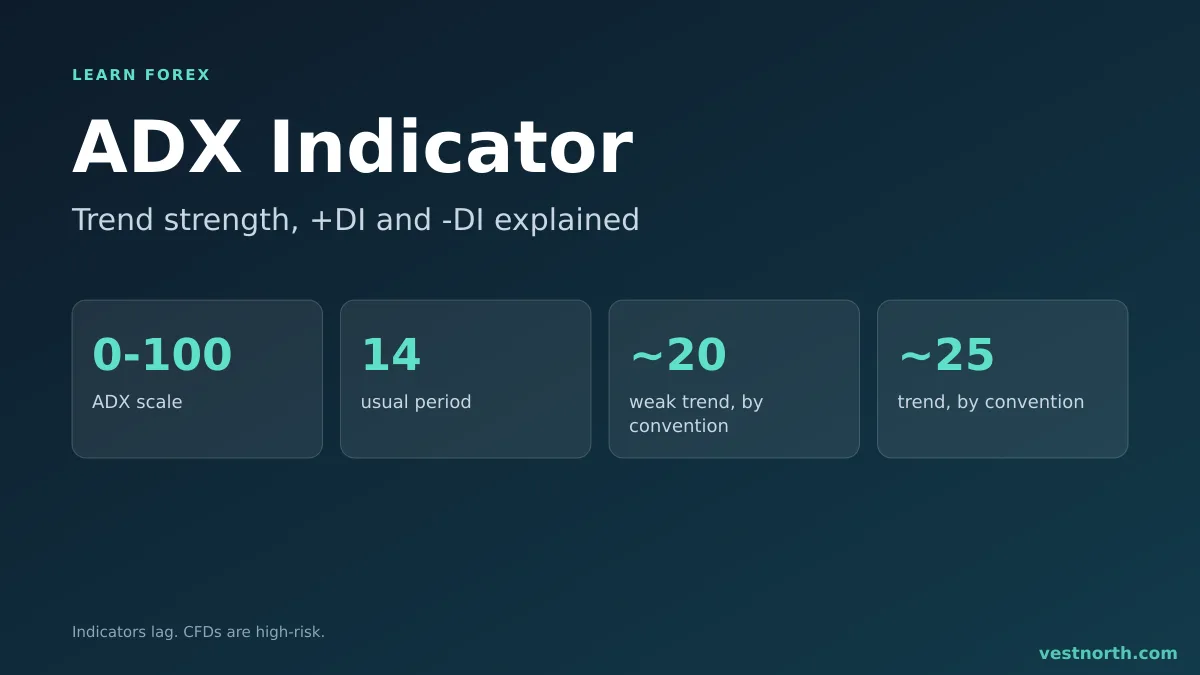
ADX with +DI and -DI. Illustration, October 2026.
What the ADX shows
The indicator was introduced by J. Welles Wilder, who also created the RSI and the ATR. It sits in a separate pane under the chart and draws three lines:
| Line | What it measures | Typical colour |
|---|---|---|
| ADX | Trend strength, with no direction | Often black or white |
| +DI | Upward movement | Often green |
| -DI | Downward movement | Often red |
A single price chart cannot tell you if a move is a strong trend or just a big move. The ADX tries to answer that part. A steady climb in small steps can give a higher ADX than one huge candle followed by silence.
How to read the lines
- ADX level. A low value suggests no clear trend. A high value suggests a strong trend.
- ADX slope. A rising ADX says the trend is strengthening. A falling ADX says it is weakening, even if price is still moving the same way.
- +DI versus -DI. The line on top shows which direction dominates. When +DI crosses above -DI, upward movement has overtaken downward movement.
Direction and strength are separate. The ADX can be at 35 and falling while price is still rising: the trend is losing strength, not reversing.
| Reading | Many traders interpret it as |
|---|---|
| ADX under about 20 | Weak trend or range. Trend-following setups are less suited |
| ADX above about 25 | A trend is present. Trend setups are worth considering |
| ADX rising, +DI above -DI | Uptrend strengthening |
| ADX rising, -DI above +DI | Downtrend strengthening |
| ADX falling from a high | Trend losing strength; a pause or a range may follow |
The 20 and 25 levels are widely used but not fixed. A pair that trends gently may have a different typical range than a volatile one, so look at the history of your own chart.
Worked example
Invented numbers to show the logic. On a EUR/USD 4-hour chart, the ADX sits at 16 for several days while price moves between 1.0800 and 1.0860. That looks like a range market, and a trend strategy would give frequent false signals.
Then price closes above 1.0860, the ADX climbs from 16 to 28 over six candles, and +DI is above -DI. A trader who follows trend trading basics might take that as a reason to look for a pullback entry. The same trader would still place a stop loss, because a rising ADX does not stop a reversal. If the ADX then falls from 38 to 30 while price stalls, the trader may tighten the stop or reduce the size.
Using the ADX with other tools
- Filter for a trend system. Take moving average crossovers only when the ADX is above your threshold. This removes some false signals in a range. It also removes some good trades, so test both versions.
- Pair with price levels. The ADX says nothing about where to enter or exit. Use support and resistance for that.
- Use ATR for the stop. The ATR measures volatility in pips, which the ADX does not. Then size the trade with position sizing.
Where the ADX misleads
- It lags. It is an average of past data, so it turns after price has turned. A high ADX can persist while a trend is already ending.
- A high ADX is not a buy or sell signal. It says the trend is strong, not that it will continue.
- A sharp spike. A news-driven jump can raise the ADX quickly, and the trend may be over when you see the reading. See the economic calendar.
- The period changes everything. A shorter period reacts faster and produces more false readings. A longer one is smoother and later. Change it only after testing on past charts.
- Crossovers in a range. +DI and -DI cross constantly when there is no trend. A cross with a low ADX carries little meaning.
Bottom line
The ADX tells you how strong a trend is, not where it is going. Use it as a filter that helps you separate trending conditions from ranges, read +DI and -DI for direction, and remember that it lags. No ADX reading removes the need for a stop loss and a position size built from it. Only risk money you can afford to lose. CFDs are complex, high-risk instruments.
Frequently asked questions
What does the ADX indicator measure?
The ADX (Average Directional Index) measures how strong a trend is on a scale from 0 to 100. It does not show whether price is rising or falling.
What is a good ADX value?
There is no official cut-off. Many traders treat readings below about 20 as a weak or absent trend and readings above about 25 as a trend worth following. These are conventions, so test them on your pair and timeframe.
What are +DI and -DI?
They are two lines that come with the ADX. +DI measures upward movement and -DI measures downward movement. When +DI is above -DI, upward movement dominates, and the reverse for downward movement.
What is the default ADX setting?
The usual setting is 14 periods, the value Welles Wilder used when he introduced the indicator. Most platforms start with 14.
Does a rising ADX mean price is going up?
No. A rising ADX means the trend is getting stronger, and that trend can be down. Read +DI and -DI or the price chart for direction.
Is the ADX a leading or lagging indicator?
It lags. It is built from averages of past movement, so it confirms a trend after it has started and can stay high after the trend has ended.