ATR Indicator in Forex: What It Measures and How to Use It
Short answer: The Average True Range (ATR) shows how many pips a pair typically moves per candle, using the last 14 candles by default. It does not show direction. Traders use it to place a stop loss at a distance that fits current volatility, and to shrink the lot size when ATR is high. If the daily ATR on EUR/USD reads 80 pips, a normal day has been about 80 pips from the lowest to the highest price, including gaps.
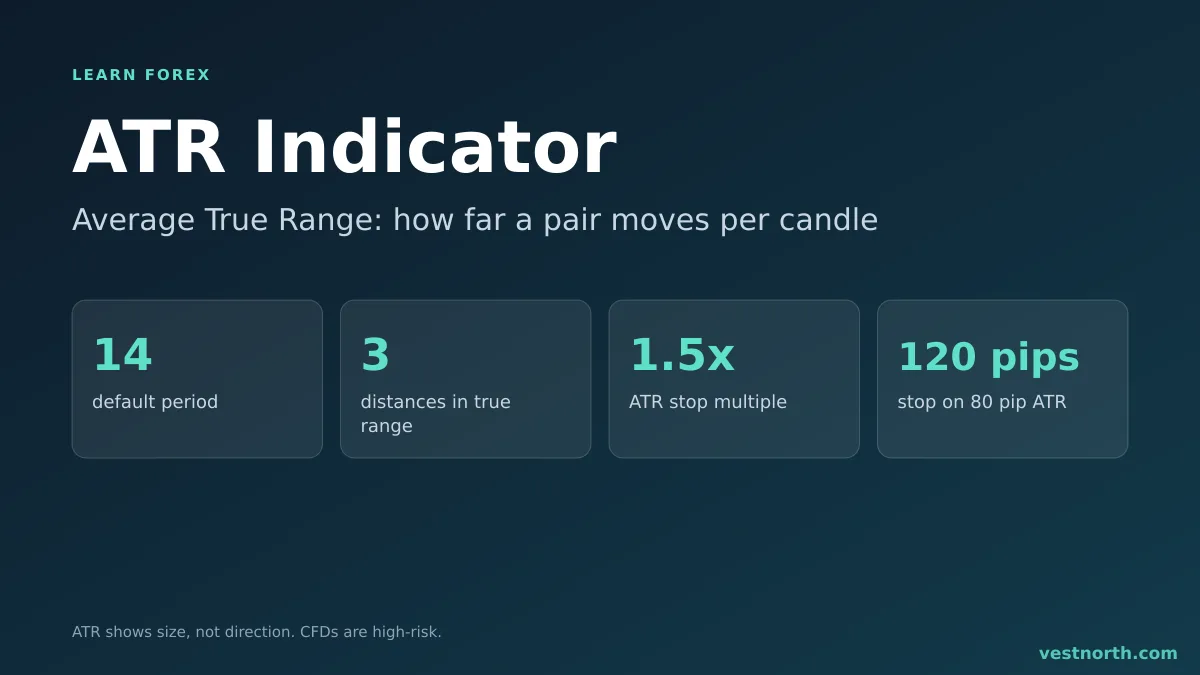
The ATR in four numbers. Illustration, October 2026.
What ATR measures
ATR is a volatility indicator. It was introduced by J. Welles Wilder in his 1978 book New Concepts in Technical Trading Systems, the same book that introduced the RSI. On a chart it appears in a separate pane under the price as a single line.
The line has no upper or lower limit like the RSI has. Its unit is the unit of price. On EUR/USD an ATR of 0.0080 means 80 pips, and on USD/JPY an ATR of 0.90 means 90 pips. Many platforms show it as a raw price number, so divide by the pip size if you want pips (see what is a pip).
Because it is an average, ATR changes slowly. One huge news candle lifts it, and it takes about as many candles as the setting to fade back.
The formula: true range, then the average
A plain high-minus-low misses gaps, so Wilder defined the true range as the largest of three distances for each candle:
- Current high minus current low.
- Current high minus the previous close (absolute value).
- Current low minus the previous close (absolute value).
The ATR is then a smoothed average of the true range over the chosen period. Wilder used his own smoothing, which gives older candles a slowly shrinking weight. Platforms differ in the smoothing they use, so the same pair can show slightly different ATR numbers on different charts. That is normal, so compare readings from the same platform only.
A small worked example
| Candle | High | Low | Previous close | True range |
|---|---|---|---|---|
| Monday | 1.0900 | 1.0840 | 1.0870 | 60 pips (high minus low) |
| Tuesday | 1.0960 | 1.0910 | 1.0890 | 70 pips (high minus previous close) |
| Wednesday | 1.0950 | 1.0870 | 1.0940 | 80 pips (high minus low) |
Tuesday shows why the formula looks at the previous close. The candle itself spans only 50 pips (1.0960 minus 1.0910), but the market opened 20 pips above Monday’s close, so the true range is 70 pips. A simple average of these three true ranges is about 70 pips. These figures are an arithmetic illustration, not market data.
Choosing the period
| Setting | Behaviour | Typical use |
|---|---|---|
| 7 or 10 | Reacts fast, noisy | Short-term trading on lower timeframes |
| 14 (default) | Balanced | Most charts and most traders |
| 20 to 30 | Slow, smooth | Swing and position trading |
Do not tune the setting until a past chart looks perfect. A parameter fitted to old data tends to fail on new data. Start with 14 and change it only for a reason you can state.
Using ATR for the stop loss
A stop that sits inside normal noise gets hit even when your idea is right. ATR gives a distance based on what the pair has actually been doing.
Method: stop distance = ATR × multiplier. Many traders start with a multiplier between 1.5 and 3 and adjust it to their style. Higher multipliers give the trade more room and mean a smaller position for the same risk.
Example: you buy EUR/USD at 1.0850 on the 1-hour chart. The 14-period ATR is 15 pips. With a multiplier of 2, the stop is 30 pips away, at 1.0820. On the daily chart the same trade would use a daily ATR, which may be 80 pips, so the stop would sit 160 pips away. Pick the chart first, then read the ATR from that chart. For how a stop works, see what is a stop loss.
Using ATR for position size
Once the stop distance is known, the lot size follows from how much money you accept to lose. The formula is in forex position sizing, and the lot size calculator does the arithmetic.
| ATR (1-hour) | Stop (2 × ATR) | Risk per trade | Lot size on EUR/USD |
|---|---|---|---|
| 10 pips | 20 pips | $50 | 0.25 lot |
| 20 pips | 40 pips | $50 | 0.125 lot |
| 40 pips | 80 pips | $50 | about 0.06 lot |
The calculation is risk ÷ (stop in pips × pip value), with a pip worth $10 per lot on EUR/USD in a dollar account. When ATR doubles, the stop doubles and the lot size halves, so the dollar risk stays at $50. This is why ATR-based sizing keeps losses steady while volatility changes. Brokers round to their own lot steps, so the exact size you can place may differ.
Reading ATR over time
- Rising ATR: candles are getting larger. This often happens around central bank decisions and at the start of a major session. See forex trading sessions.
- Falling ATR: candles are shrinking, common in quiet periods and when price moves sideways in a range.
- Very low ATR compared with its recent history: some traders treat it as a sign that a breakout may be close. It is not a signal by itself, and many quiet periods end without a clear move.
For a wider look at what drives these changes, read forex volatility explained.
Limits of ATR
- It is backward-looking. It describes recent candles, not the next one. A scheduled announcement can produce a candle several times the ATR.
- It gives no direction, so it must be paired with a view of the trend or levels.
- It differs between platforms because of smoothing, so never copy a value from one platform into another.
- It is per timeframe. The 5-minute and daily ATR on the same pair are different numbers.
- A stop at 2 × ATR does not stop the price from going beyond it. Gaps and fast markets can fill your order at a worse price, as explained in slippage.
Common mistakes
- Using the daily ATR for an intraday trade. The stop ends up far too wide for the chart you are trading.
- Reading the raw number as pips on yen pairs. An ATR of 0.90 on USD/JPY is 90 pips, not 0.9.
- Keeping the same lot size when ATR jumps. The same lot now risks twice as many dollars.
- Treating a low ATR as a buy or sell signal. It only says candles are small.
- Ignoring the spread. On a 10-pip ATR chart, a spread of 1.2 pips is more than a tenth of a typical candle.
Related indicators: Bollinger Bands.
Bottom line
ATR turns “how much does this pair move” into a number you can plan around. Read it on the timeframe you trade, multiply it to set the stop, and let the stop distance decide your lot size. It does not predict direction, and a stop based on it can still be gapped through. Only risk money you can afford to lose, because leveraged CFDs can lose value quickly.
Frequently asked questions
What does ATR mean in forex?
ATR stands for Average True Range. It is the average of the true range over a set number of candles, usually 14, and it is shown in the same units as price, which on most pairs means pips.
Does ATR show the direction of the trend?
No. ATR only measures the size of moves. A rising ATR means candles are getting bigger, whether price is rising or falling.
What is the default ATR setting?
Most platforms default to 14 periods, the value J. Welles Wilder used when he introduced the indicator in 1978. You can change it, but a shorter period reacts faster and a longer one is smoother.
How do I set a stop loss with ATR?
Multiply the current ATR by a factor such as 1.5 or 2 and place the stop that distance from your entry. With a daily ATR of 80 pips and a factor of 1.5, the stop sits 120 pips away.
Is a high ATR good or bad?
It is neither. A high ATR means larger moves, which gives more room for profit and for loss. It calls for wider stops and smaller position sizes to keep the money at risk the same.
Which timeframe should I read ATR on?
Read it on the timeframe you trade. ATR on the 1-hour chart describes hourly candles and ATR on the daily chart describes daily candles, so the two numbers are not interchangeable.