Bollinger Bands in Forex: A Beginner's Guide
Short answer: Bollinger Bands are three lines: a 20-period moving average in the middle and an upper and lower band 2 standard deviations away. The bands widen when price becomes more volatile and narrow when it is quiet. A touch of a band is not a buy or sell signal, because price can ride a band for a long time in a trend.
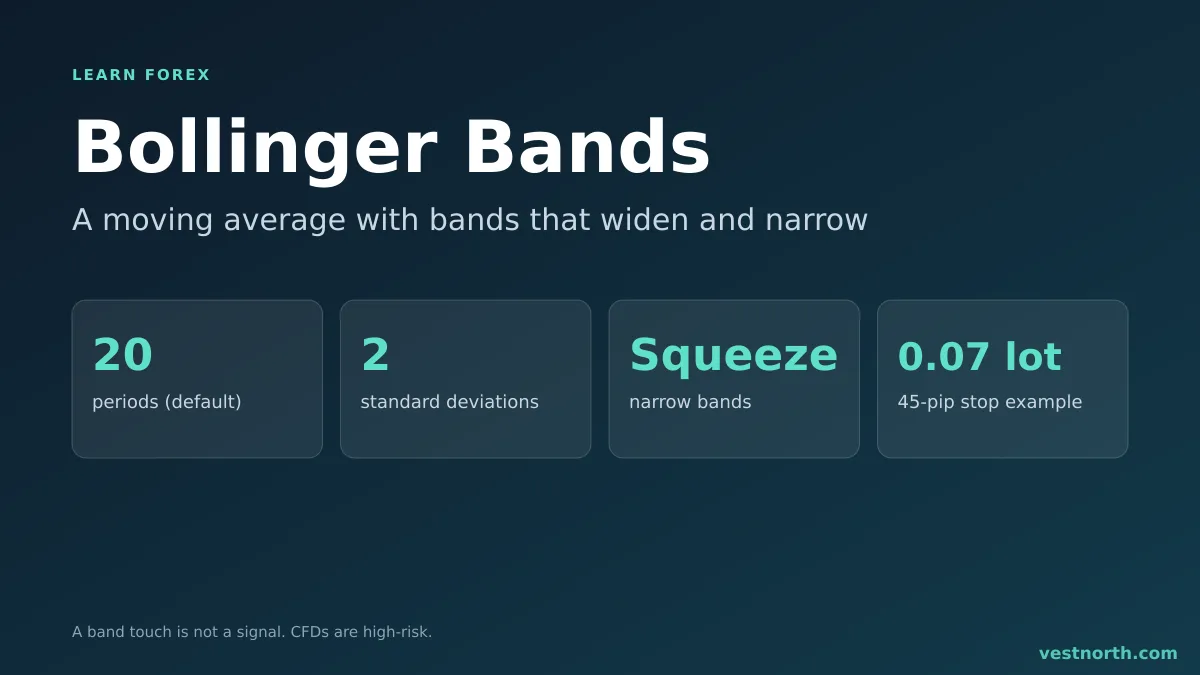
Bollinger Bands with a squeeze followed by an expansion. Illustration, October 2026.
What the bands are
The middle line is a simple moving average of the last 20 closes. The upper and lower bands sit 2 standard deviations above and below it. A standard deviation is a measure of how spread out recent prices are. When prices have moved a lot, the number is large and the bands are wide. When prices have been flat, it is small and the bands are tight.
The usual setting is written as (20, 2). The 20-period average on a daily chart covers about four weeks of trading days. On a 1-hour chart it covers 20 hours. Changing the number of periods or standard deviations changes how often price touches the bands. Your platform draws the lines for you.
What the bands tell you
Mostly they show volatility on the chart, not direction. Wide bands mean recent movement has been large, and narrow bands mean it has been small. See forex volatility explained for how this affects stops and lot size.
They also give a visual sense of “high” and “low” compared with the recent average. In a sideways market, price often moves between the bands and back toward the middle. In a trend, it can stay near one band. That is why the same touch can mean opposite things, depending on whether the market is ranging or trending.
Squeeze and expansion
A squeeze is when the bands tighten after a quiet period. Many traders treat it as a sign that a bigger move may come, since quiet periods have often been followed by active ones. It says nothing about direction. After a squeeze, price may:
- break up and keep going,
- break down and keep going, or
- break one way and reverse. See fakeout.
The direction of the first breakout is not a reliable guide. Some traders wait for a close outside the band, or for a retest, which costs a later entry.
A worked example
GBP/USD has traded in a tight 40-pip range for two days and the bands have narrowed. Price then closes above the upper band at 1.2760. A trader buys at 1.2765 with a stop at 1.2720, below the middle of the old range, a risk of 45 pips.
On a $3,000 account risking 1% ($30), the lot size is $30 ÷ (45 × $10) = about 0.07 lot. If the target is 90 pips away, at 1.2855, the ratio is 2:1. The lot size calculator checks the sum, and risk to reward explains the ratio.
If price falls back inside the bands and hits 1.2720, the loss is close to $30. A stop can fill worse in a fast market (slippage), and a break close to a data release can reverse quickly, so check the economic calendar.
Limits of Bollinger Bands
- They are built from past prices, so they lag.
- The bands are not support and resistance. For levels, see support and resistance.
- Price outside a band is normal. Bands do not contain 100% of price action.
- A signal on a short time frame is noisy, and the spread takes a bigger share of a small move.
- In a trend, band touches in the trend direction can repeat for many candles.
Common mistakes
- Selling every touch of the upper band.
- Reading a squeeze as a prediction of direction.
- Using the band as a stop without checking the swing point.
- Applying one setting to every pair and time frame without checking.
Try the indicator on a demo account. Demo fills are cleaner than live ones.
Bottom line
Bollinger Bands show how spread out recent prices have been, with a moving average in the middle. They help you see when markets are quiet or active, and they do not tell you which way price goes next. Use them with a trend and a price level, put the stop where the idea fails and size the lot from that stop. CFDs are complex, high-risk instruments, so only trade money you can afford to lose.
Frequently asked questions
What are Bollinger Bands in forex?
Bollinger Bands are three lines on a chart: a moving average in the middle and an upper and lower band set a number of standard deviations away. The bands widen when price is more volatile and narrow when it is quiet.
What are the default Bollinger Band settings?
Most platforms use a 20-period simple moving average and 2 standard deviations. You can change both, but the shape of the bands changes with them.
Does price touching the upper band mean sell?
No. A touch means price is high compared with its recent average. In a strong trend, price can move along the upper band for many candles. Selling there without a stop is a common error.
What is a Bollinger Band squeeze?
A squeeze is when the bands move close together after a quiet period. It shows low recent volatility. It does not tell you the direction of the next move, and price can break either way or fake out.
Can Bollinger Bands set my stop loss?
They can be a reference, but the stop should go where your trade idea is wrong. Set the lot size from the distance between entry and stop.
Do Bollinger Bands work on every time frame?
They can be plotted on any time frame, but a signal on a 5-minute chart is noisier than one on a daily chart. Spreads also take a larger share of small moves on short time frames.