Moving Averages in Forex: SMA, EMA and Crossovers for Beginners
A moving average is the average closing price of the last N candles, redrawn every time a new candle closes. Plotted on a chart, it becomes a smooth line that follows price at a delay. Traders use it to judge direction and to spot where price has moved far from its recent average. It is a description of past prices and says nothing certain about the next candle.
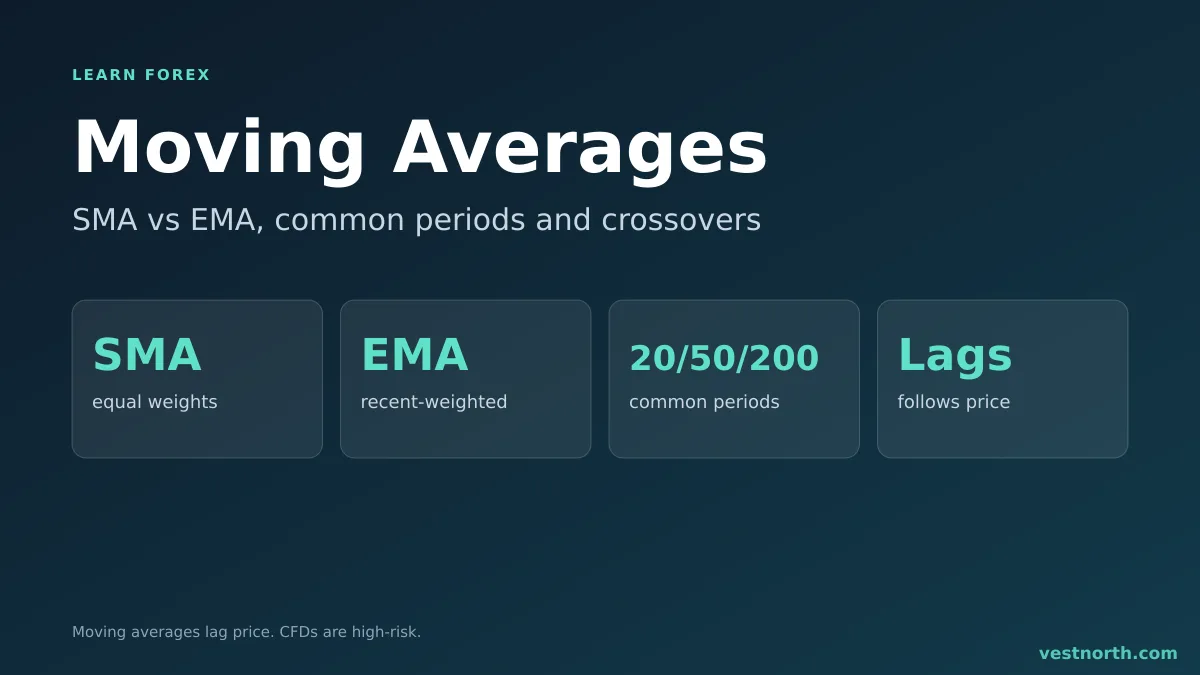
The main points of this guide.
How a simple moving average is calculated
The simple moving average (SMA) adds up the last N closing prices and divides by N. Take five daily closes on EUR/USD (an illustrative example, not live data):
| Day | Close |
|---|---|
| 1 | 1.0820 |
| 2 | 1.0835 |
| 3 | 1.0850 |
| 4 | 1.0842 |
| 5 | 1.0868 |
The total is 5.4215. Divided by 5, the 5-period SMA is 1.0843. When day 6 closes, day 1 drops out of the calculation and day 6 comes in, which is why the line “moves”. A 20-period SMA on a daily chart averages the last 20 days. On a 1-hour chart it averages the last 20 hours.
How an exponential moving average differs
The exponential moving average (EMA) uses the same closing prices but multiplies recent ones by a larger weight. The standard smoothing factor is 2 ÷ (N + 1). For a 5-period EMA that is 2 ÷ 6, or about 0.333.
Each new EMA is:
new EMA = (close × 0.333) + (previous EMA × 0.667)
If the previous EMA was 1.0840 and the new close is 1.0868, the result is about 1.0849. The SMA of the same data is 1.0843, so the EMA has moved further toward the latest price. For a 20-period EMA the factor is 2 ÷ 21, about 0.095, so each new candle carries roughly 9.5% of the weight.
Your charting platform does this maths for you. What matters is the behaviour:
| SMA | EMA | |
|---|---|---|
| Weighting | Equal for every candle in the period | Heavier on recent candles |
| Reaction to a sudden move | Slower | Faster |
| Whipsaws in choppy markets | Fewer | More |
Neither is better in general. A faster line catches turns earlier and also gives more false alarms.
What the common periods show
The period sets how much history the line averages. Short periods hug price. Long periods smooth out more noise and react later.
- 20: roughly one month of daily candles. Often used as a short-term trend guide.
- 50: about two and a half months of daily candles. A medium-term reference.
- 200: about ten months of daily candles. Many traders treat it as the line between a long-term uptrend and downtrend.
Nobody has shown that these numbers are special. They are watched because many people watch them, and that is the whole case for them. Use the same period on the same time frame for a while before you judge how it behaves on a pair.
Reading direction and slope
Two simple readings need no further indicator:
- Slope: a line rising over many candles describes an uptrend in closing prices. A flat line describes a market going nowhere.
- Position: price closing above the line and staying above it suggests buyers have been in control. Price below suggests sellers.
Combine this with the chart structure covered in how to read a forex chart. A line is easier to trust when it agrees with what the candles already show, such as higher highs and higher lows.
Moving average crossovers
A crossover is when a faster average crosses a slower one.
- A fast line crossing above a slow line is a bullish cross.
- A fast line crossing below is a bearish cross.
- On daily charts, the 50-period crossing above the 200-period is called a golden cross, and the reverse a death cross. The names are popular, but they carry no guarantee.
Crossovers are late by design. Both lines are built from past closes, so by the time the cross prints, a large part of the move may be over. In a sideways range, the lines weave through each other and a crossover system keeps entering just before price reverses.
Moving averages as dynamic support and resistance
In a steady trend, price often pulls back toward a rising average and then continues. Traders watch a line such as the 20 or 50 EMA the way they watch a horizontal level. Unlike a fixed level, the average moves each candle. Compare this with the horizontal levels in support and resistance. The two ideas work best when they meet: a pullback to a rising average that also sits on an old resistance level that has turned into support.
Price does not have to respect the line. In a strong move it can ignore it for many candles, and in a weak one it can slice through it and keep going.
A worked example
Suppose EUR/USD has been above a rising 50-period EMA on the 4-hour chart for two weeks. Price pulls back and touches the line at 1.0880. A trader who wants to buy that pullback might place a stop loss below the recent swing low at 1.0850, a 30-pip risk, with a target at 1.0940, 60 pips away. That is a 2:1 ratio before the spread. On a 0.10 lot, a pip is worth about $1, so the risk is about $30. The lot size calculator and the pip calculator do this sum for other pairs.
The average gave a reference point. It did not tell the trader that price will bounce. If the 4-hour candle closes well below the line, the stop is hit and the loss is taken.
Limits and common mistakes
- Lag. Every moving average trails price. A faster setting shortens the lag and adds more false signals.
- Ranges. In a sideways market, averages flatten and crossovers fire in both directions.
- Stacking. Adding five averages to one chart rarely adds information, because all of them come from the same closing prices.
- No stop. An average is not a stop loss. See what is a stop loss and risk management in forex.
- Over-fitting. Choosing the period that looks best on last month’s chart tells you little about next month.
Try any setting on a demo account before you risk money. A demo does not reproduce live slippage or widened spreads, so expect live results to differ.
Related indicators: the Ichimoku cloud, trading with the VWAP and the MACD indicator.
Bottom line
A moving average turns recent closing prices into one smooth line. The SMA weights all candles equally, the EMA favours recent ones, and the period you choose sets how fast the line reacts. Use it to see direction and to mark a rough area where price might pause, and expect it to lag. Size every trade from the distance to your stop, and risk only money you can afford to lose. CFDs are complex, high-risk instruments.
Frequently asked questions
What is a moving average in forex?
A moving average is the average closing price over the last N candles, redrawn on every new candle. It smooths price into one line so the direction is easier to see.
What is the difference between SMA and EMA?
The simple moving average (SMA) gives every candle in the period the same weight. The exponential moving average (EMA) gives more weight to recent candles, so it turns sooner and follows price more closely.
Which moving average period is best?
No period works best on every pair and time frame. The 20, 50 and 200 are popular because many traders watch them, but a popular number is not a proven edge. Test any setting on a demo account first.
What is a moving average crossover?
A crossover happens when a faster average (for example the 20) crosses a slower one (for example the 50). Traders read a cross upward as a sign of rising momentum and a cross downward as falling momentum.
Do moving averages predict price?
No. They are calculated only from past prices, so they describe what has already happened. They lag, and in a sideways market they produce many false crossovers.