Trading with the VWAP in Forex: What It Shows and Where It Falls Short
Short answer: The VWAP (volume-weighted average price) is the average price of a session where busy candles count for more than quiet ones. In shares and futures the volume is real traded volume. In spot forex there is no central exchange, so a platform VWAP is normally built from tick volume (the number of price updates). That makes it a rough guide to where price has spent its time, not a record of where money changed hands. Traders use it as a dynamic reference line: buyers lean long above it, sellers lean short below it, and some look for a move back toward it.
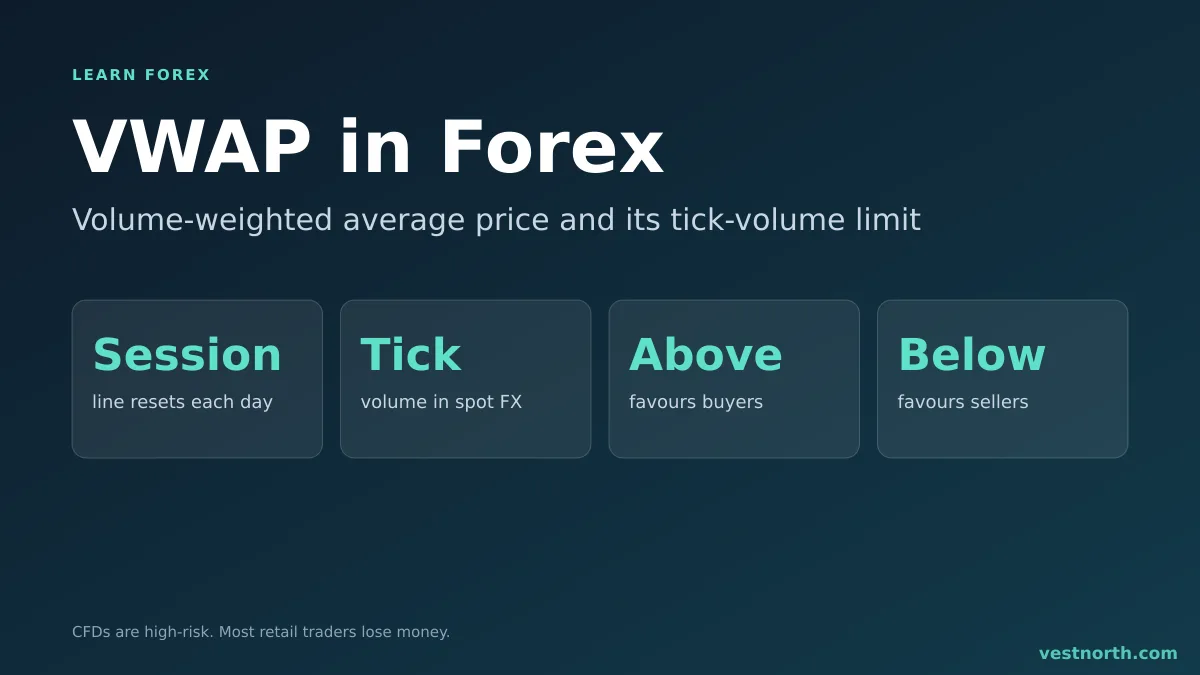
VWAP idea, with a tick-volume caveat for spot forex. Illustration, November 2026.
What VWAP is
A simple average treats every price equally. VWAP weights each price by volume. If 70% of the activity in a session happened between 1.0840 and 1.0850, the VWAP sits close to that zone, even if price spent a few minutes at 1.0900.
The line is cumulative. It starts fresh at a set time (often the session open or midnight on the platform clock) and uses every candle since then. That is the main difference from a moving average, which only looks at a fixed number of recent candles.
The calculation
For each candle:
- Typical price = (high + low + close) / 3
- Multiply it by the candle volume
- Add this to a running total
- Divide the running total by the running sum of volume
A small example with made-up numbers:
| Candle | Typical price | Volume | Price x volume |
|---|---|---|---|
| 1 | 1.0840 | 200 | 216.80 |
| 2 | 1.0850 | 600 | 651.00 |
| 3 | 1.0870 | 200 | 217.40 |
| Total | 1,000 | 1,085.20 |
VWAP after three candles = 1,085.20 / 1,000 = 1.0852. The simple average of the three prices is 1.0853. The busy middle candle pulled the VWAP toward 1.0850.
The spot forex problem
Stocks and futures trade on exchanges that publish how many shares or contracts changed hands. Spot forex is traded over the counter, through many banks and liquidity providers. No single feed shows the total.
What a retail platform usually shows is tick volume: how many times the price updated in each candle. It tends to rise when the market is active, so it correlates loosely with real volume. But a candle with two large trades and a candle with two hundred small ones can show very different tick counts. We have no verified figure for how closely tick volume tracks real volume, so do not read the VWAP line as precise. Check how your own platform defines volume, and note that two brokers’ feeds can give slightly different lines.
Futures-based volume (for example currency futures) is sometimes used as a proxy, but it covers only one venue.
How traders use VWAP
As a bias line
Price above the VWAP means the average buyer in the session is in profit; price below means the average seller is. Some traders only look for longs above the line and shorts below it. This is a filter, not a signal.
As a pullback level
In a trending session, price may fall back to the line, pause, and continue. That resembles a pullback entry, with the VWAP as the level to watch. A rejection candle such as a pin bar adds a reason to act.
As a mean-reversion target
When price stretches far from the line in a quiet market, some traders aim for a move back to it. This is the idea behind mean reversion. It fails in a strong trend, where price can stay on one side for the whole session.
Worked example (illustrative figures)
On a 15-minute EUR/USD chart, the session VWAP sits at 1.0852. Price opens the London session above it, falls back to 1.0853, and prints a bullish pin bar.
| Item | Level | Distance |
|---|---|---|
| Entry (above the pin bar high) | 1.0860 | |
| Stop (below the pin bar low, beyond the line) | 1.0843 | 17 pips |
| Target (session high) | 1.0894 | 34 pips |
| Reward to risk | 2 to 1 |
Risking 1% of a 3,000 USD account (30 USD) over 17 pips gives about 1.76 USD per pip, or roughly 0.18 lot where one pip is 10 USD per lot. Use the lot size calculator for your own figures. These levels are invented for the example and are not a signal.
Limits to keep in mind
- Session choice changes the line. A reset at midnight and a reset at the London open give different lines. Pick one and keep it.
- Late in the session it barely moves. With thousands of candles in the average, the line turns flat and lags price.
- Thin hours distort it. Overnight, tick volume is low, so a few price updates can pull the line. See trading sessions for when activity is highest.
- News breaks the pattern. A data release can drive price far from the line in seconds. Check the economic calendar first.
- It tells you nothing about the future. It describes where the session has traded, nothing more.
Bottom line
VWAP weights the average price by volume and restarts each session. In spot forex the volume is usually tick volume, so the line is an approximation. Use it as a reference for bias, pullbacks or a move back to average, always with a stop beyond a swing point. Test the idea on a demo account before using real money. Only risk money you can afford to lose. CFDs are complex, high-risk instruments.
Frequently asked questions
What does VWAP mean in forex?
VWAP stands for volume-weighted average price. It is the average price over a period where each price counts in proportion to the volume traded at it. On a chart it appears as a single line that usually restarts at the beginning of a session or day.
Is VWAP reliable in spot forex?
It is less reliable than in exchange-traded markets. Spot forex has no central exchange, so there is no single volume figure. Most platforms substitute tick volume, which counts price updates, not units traded. Treat the line as a rough guide.
How is VWAP calculated?
For each candle, multiply the typical price (high plus low plus close, divided by three) by the volume. Add these up from the start of the session, then divide by the total volume so far.
Is VWAP a moving average?
It is a cumulative average that restarts at a set time. A moving average drops old candles from its window, while VWAP keeps every candle since the reset, so it reacts more slowly as the session goes on.
Which timeframe works best with VWAP?
VWAP is built for intraday charts such as the 5-minute to 1-hour. On daily charts a session-reset line has little to describe.
Does price tend to return to VWAP?
Price often moves back toward the line in quiet markets, which is why some traders treat it as a mean-reversion level. In a strong trend price can stay on one side for hours, so it is not a guarantee.
Where do I put the stop loss on a VWAP trade?
Place it beyond the recent swing point or beyond the line plus a buffer for spread and noise, then size the position from that distance.