Forex Pullback Trading Basics: How to Enter a Trend After a Dip
Short answer: A pullback is a short move against the main trend, for example a dip inside an uptrend. Pullback traders wait for the dip and enter when price turns back in the trend direction, instead of buying after a long run. The stop goes beyond the pullback’s low (uptrend) or high (downtrend), so if the trend structure breaks the trade closes. The hard part is telling a pullback from a reversal, and nobody can do that in advance. Entries improve the price, they do not remove the risk.
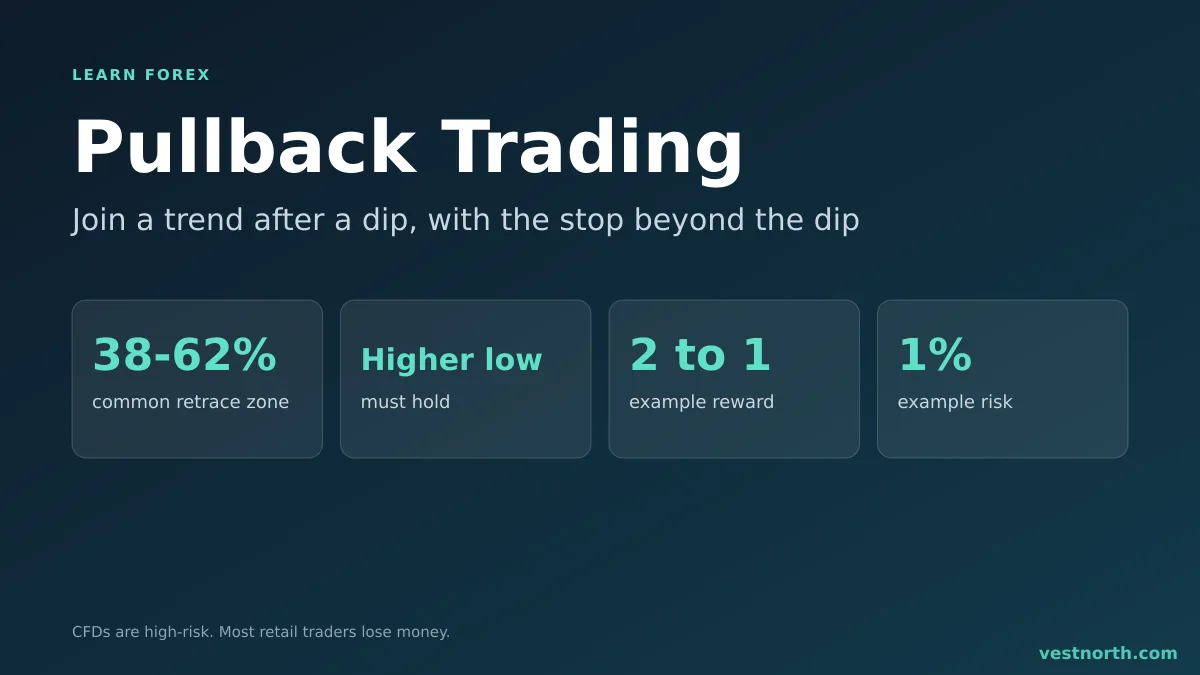
Pullback in an uptrend. Illustration, November 2026.
What a pullback is
Trends do not move in a straight line. An uptrend makes higher highs and higher lows (see market structure). The dip from a high to the next higher low is the pullback. In a downtrend it is the bounce from a low to the next lower high.
The appeal is price and risk. Buying after a dip puts the stop closer than buying at the top of a run, so the same risk in dollars can allow a bigger position or a better reward to risk. The cost is that sometimes the dip never ends, and the trade is stopped out.
Pullback or reversal?
| Sign | More like a pullback | More like a reversal |
|---|---|---|
| Structure | Higher low holds (uptrend) | Lower low forms |
| Depth | Shallow to moderate | Goes past the previous swing |
| Candles | Small bodies, overlapping | Large bodies against the trend |
| Higher timeframe | Still trending the same way | Hits a major level on the other side |
| Speed | Slow drift | Sharp, fast move |
None of these is proof. A dip that looks like a pullback at the 50% level can still turn into a reversal. That is why every pullback trade needs a stop, placed where the trend idea is wrong.
Where traders look for the entry
Support, resistance and trend lines
A dip to a previous support or resistance level, or to a rising line (see trend lines), gives a defined area. The entry waits for a sign that buyers have returned.
Moving averages
Some traders watch a moving average such as the 20 or 50 period as a dynamic level. See moving averages. The settings are a personal choice and the average is a guide, not a wall.
Fibonacci levels
The 38.2%, 50% and 61.8% levels of the last move are common areas of interest. See Fibonacci retracement and retracements.
Confirmation candles
A pin bar, engulfing candle or hammer at the level shows rejection. Entering on a pending order above the confirmation candle’s high (uptrend) avoids guessing the turn. See pending orders.
A step-by-step routine
- Identify the trend on a higher timeframe, such as the 4-hour chart.
- Wait for the dip toward a level you marked in advance.
- Look for rejection on your entry timeframe.
- Place the entry and stop before you take the trade, with the stop beyond the pullback extreme.
- Set a target at the previous swing high, or use a trailing stop (see trailing stops).
- Skip it if the reward to risk is below your minimum or news is due.
Worked example (illustrative figures)
On a 4-hour GBP/USD chart in an uptrend, price rises from 1.2500 to 1.2700, then pulls back to 1.2620 (a 40% retracement), where a rising trend line and the previous resistance meet. A bullish engulfing candle closes at 1.2640 with a low of 1.2616.
| Item | Level | Distance |
|---|---|---|
| Entry (above the engulfing candle high) | 1.2644 | |
| Stop (below the pullback low, plus buffer) | 1.2606 | 38 pips |
| Target (prior swing high) | 1.2720 | 76 pips |
| Reward to risk | 2 to 1 |
Risking 1% of a 4,000 USD account (40 USD) over 38 pips gives about 1.05 USD per pip, roughly 0.1 lot where one pip is 10 USD per lot. Use the lot size calculator for your own numbers. The levels are invented and are not a signal. Read risk reward ratio before choosing a target.
What goes wrong
- Catching a reversal. The dip keeps going and the stop is hit. This is the normal cost of the method.
- Entering too early. Buying at the first touch of the level, before any sign of rejection.
- Stops inside the noise. A stop only a few pips beyond the level is often taken by a wick. See stop hunts.
- Ignoring spread. On a short stop, the spread is a larger share of the risk. See trading costs.
- Trading against a higher timeframe. A pullback in a 15-minute uptrend can be one leg of a larger downtrend.
Pullbacks also fail in range markets, where there is no trend to rejoin. See range markets and trend trading.
Bottom line
A pullback entry joins an existing trend after a dip, with the stop beyond the dip’s extreme. It gives a closer stop than chasing, but it cannot tell you in advance whether the dip is a pause or the start of a reversal. Mark levels first, wait for rejection, size the position from the stop and keep a log. We have no verified win rate for the method, so test it on a demo account. Only risk money you can afford to lose. CFDs are complex, high-risk instruments.
Frequently asked questions
What is a pullback in forex?
A pullback is a short move against the main trend, such as a dip inside an uptrend, after which price resumes in the trend direction. Traders use it to join a trend at a better price than chasing a breakout.
What is the difference between a pullback and a reversal?
A pullback keeps the trend structure intact: in an uptrend the higher low holds. A reversal breaks that structure, for example by making a lower low. You can only tell with certainty afterwards, which is why the stop matters.
How deep can a pullback go?
There is no fixed limit. Many traders watch the 38.2%, 50% and 61.8% Fibonacci levels as areas of interest, and some use a moving average. A pullback that goes past the previous swing low suggests the trend may be over.
Is a pullback the same as a retracement?
The words are used almost interchangeably. Retracement usually refers to the measured size of the move back, pullback to the trading setup around it.
Which indicators help with pullback trading?
Common choices are a moving average, Fibonacci levels, horizontal support and resistance, and a trend line. None is required, and a second reason at the same price makes the setup stronger.
Where should the stop loss go on a pullback trade?
Beyond the swing low of the pullback in an uptrend, or beyond the swing high in a downtrend, plus a small buffer for spread. If price reaches it, the pullback idea has failed.
Can pullbacks be traded on any timeframe?
Yes, but lower timeframes have more noise and a larger share of costs compared with the stop distance. Many traders find the trend on a higher timeframe and enter on a lower one.