What Is Forex Market Structure? Swing Highs, Swing Lows and Structure Breaks Explained
Short answer: Market structure is the pattern of swing highs and swing lows on a chart. Higher highs and higher lows mean an uptrend, lower highs and lower lows mean a downtrend, and swings that overlap mean a range. A close beyond the last swing point is called a structure break. It shows that the pattern has changed, not that price will keep going.
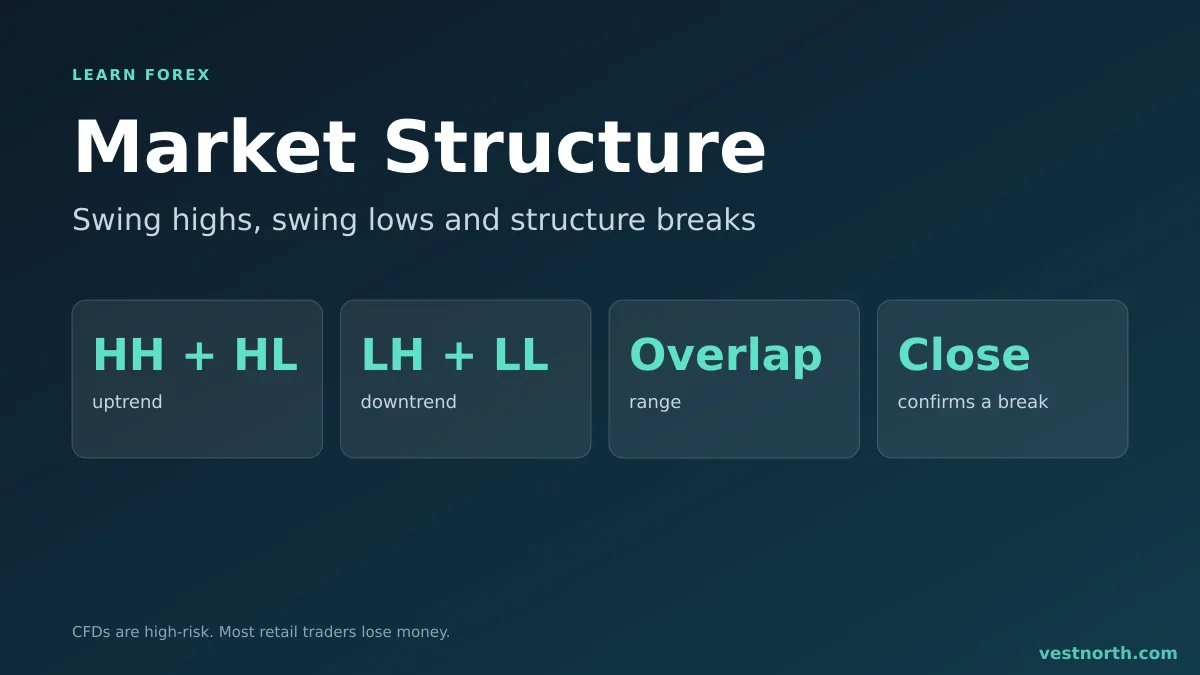
Market structure in three states. Illustration, October 2026.
Swing highs and swing lows
Structure is built from swing points, so start there.
- A swing high is a peak that has lower highs on both sides.
- A swing low is a trough that has higher lows on both sides.
How many candles count as “both sides” is a choice. A common setting is two to five candles each way. Fewer candles give more swings and more noise, and more candles give fewer swings that appear later. Pick one setting per chart and keep it.
A swing point is only confirmed after the candles on its right have printed. The latest peak on the screen is not yet a swing high, because price may still be rising. This is the main reason structure looks cleaner in hindsight than it does live.
The three states
| State | Swing pattern | Common reading |
|---|---|---|
| Uptrend | Each high and each low is above the one before | Buyers are in control; pullbacks to the last higher low are watched |
| Downtrend | Each high and each low is below the one before | Sellers are in control; bounces to the last lower high are watched |
| Range | Highs and lows overlap inside a band | No clear direction; see the range market guide |
The trend trading guide covers the first two states in more detail. Many pairs spend long periods in the third state, so check for it before assuming a trend.
Break of structure and shift in structure
Two terms are used for a close beyond a swing point. Different teachers define them slightly differently, so treat these as common usage rather than a standard.
- Break of structure (BOS): a close beyond the last swing point in the direction of the trend. In an uptrend, a close above the previous swing high. It is usually read as continuation.
- Shift in structure (also called change of character): a close beyond the last swing point against the trend. In an uptrend, a close below the most recent higher low. It is usually read as a warning that the trend may be ending.
Use closes, not wicks, or you will mark many breaks that price immediately reverses. A wick through a level followed by a close back inside is a fakeout, not a break.
A worked example
Invented numbers for illustration. On a GBP/USD 1-hour chart, price makes a swing low at 1.2600, a swing high at 1.2680, a higher swing low at 1.2640 and a higher swing high at 1.2720. That is an uptrend by the swing definition.
| Event | Level | What it means |
|---|---|---|
| Last higher low | 1.2640 | The level that must hold for the uptrend to stay intact |
| Last swing high | 1.2720 | A close above is a break of structure |
| Close at 1.2735 | Above 1.2720 | Break of structure; the uptrend continues |
| Later close at 1.2630 | Below 1.2640 | Shift in structure; the pattern of higher lows is broken |
A trader who buys a pullback to 1.2645 might put a stop loss at 1.2625, just under the last higher low, risking 20 pips. If a close below 1.2640 is the signal that the idea is wrong, the stop sits where the idea fails. The lot size calculator turns that 20 pips into a position size for a chosen risk amount.
How traders use structure
Most uses fall into three groups:
- Direction filter. Trade only in the direction of structure on a higher timeframe, for example buys while the daily chart makes higher lows.
- Stop placement. Put the stop beyond the swing point that, if broken, invalidates the idea.
- Exit signal. Close or reduce a trade when a shift in structure appears.
Structure works best next to other tools. Pullback depth can be checked with a retracement tool, and horizontal levels with support and resistance.
Where structure analysis goes wrong
- Hindsight bias. Swings are confirmed late, so a chart that looks obvious now was unclear while it formed.
- Different swing settings. Two traders with different settings mark different structure on the same chart.
- Timeframe conflict. A shift on the 15-minute chart may be a small pullback on the daily chart.
- Noise around news. A scheduled release can print a long candle that breaks structure and reverses. Check the economic calendar.
- Overfitting. If you have to move the swing points to make the story work, there is no clean structure.
Related chart patterns and levels: pullback trading, channel trading and supply and demand zones.
Bottom line
Market structure turns a chart into a simple sequence of swing highs and lows, which tells you whether price is trending or ranging and where an idea would be proved wrong. It describes the past and gives no guarantee about the next candle. Mark swings with one consistent setting, use closes for breaks, and size every trade from the stop distance. Only risk money you can afford to lose. CFDs are complex, high-risk instruments.
Frequently asked questions
What is market structure in forex?
It is the order of swing highs and swing lows on a chart. Higher highs and higher lows describe an uptrend, lower highs and lower lows describe a downtrend, and overlapping swings describe a range.
What is a swing high and a swing low?
A swing high is a peak with lower highs on both sides of it. A swing low is a trough with higher lows on both sides. Traders choose how many candles count as 'both sides', commonly two to five.
What is a break of structure?
It is a close beyond the last swing point in the direction of the trend, for example a close above the previous swing high in an uptrend. It is usually read as the trend continuing.
What is a change of character or market structure shift?
It is a close beyond the last swing point against the trend, such as a close below the last higher low in an uptrend. It warns that the trend may be ending, but price can recover.
Does market structure work on every timeframe?
The idea applies to any timeframe, but a lower timeframe has more swings and more false signals. Many traders mark structure on a higher chart and look for entries on a lower one.
Is market structure a reliable signal?
No. It describes what price has done, not what it will do. Swings are marked after the fact, and a structure break can fail. Use it with a stop loss and sensible position sizing.