Forex Channel Trading for Beginners: How to Draw a Channel and Trade It
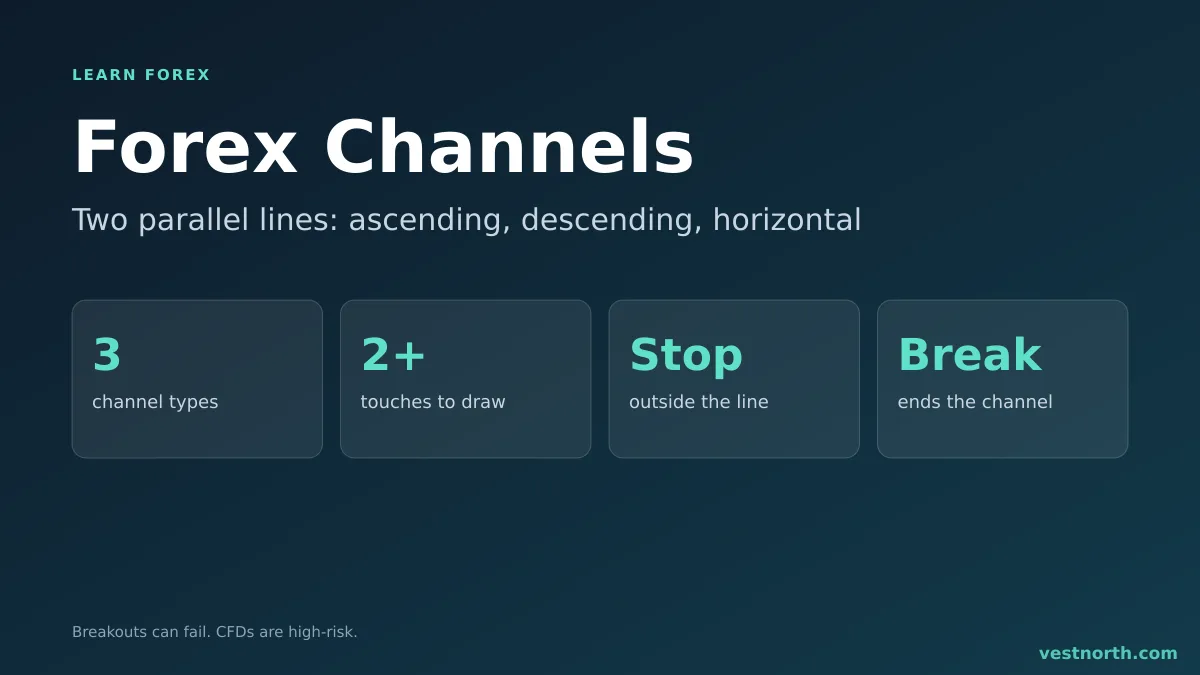
Short answer: A channel is a band between two roughly parallel trend lines. Price moves up and down inside it. In an ascending channel both lines slope up, in a descending channel both slope down, and in a horizontal channel both are flat. Traders buy near the lower line and sell near the upper line, with a stop just outside the line they used. A close beyond either line suggests the channel has ended.
An ascending channel with entry, stop and target marked. Illustration, October 2026.
How to draw a channel
- Find a trend or range on your chart and pick the two swing lows (or highs) that define its direction.
- Draw the base line through those two points. In an uptrend it joins swing lows. In a downtrend it joins swing highs.
- Copy that line and drag the copy to the opposite extreme, so it touches the highest swing high (uptrend) or lowest swing low (downtrend) in the same window.
- Check that price has touched each line at least once and mostly stayed between them.
Lines are drawn by eye, so two traders will draw slightly different channels. Wicks versus candle bodies is a personal choice. Pick one and use it every time. The candlestick basics guide explains the parts of a candle.
The three types
| Type | Slope | Lower line | Upper line | Common trade |
|---|---|---|---|---|
| Ascending | Up | Support, buy zone | Resistance, take-profit zone | Buy dips to the lower line |
| Descending | Down | Support, take-profit zone | Resistance, sell zone | Sell rallies to the upper line |
| Horizontal | Flat | Support | Resistance | Buy low, sell high within the range |
A horizontal channel is a range market by another name. The rectangle pattern is the same shape viewed as a pattern before a breakout.
A channel whose lines converge is not a channel, it is a wedge or a triangle, which behave differently.
A worked trade
Invented numbers for illustration. On a USD/JPY 4-hour chart, price has risen in an ascending channel. The lower line sits at 148.40 at the latest touch and the upper line at 149.60 at the same time. The channel is about 120 pips wide at that point. Price pulls back to the lower line and a bullish candle forms there.
| Item | Level | Comment |
|---|---|---|
| Entry (buy) | 148.45 | just above the lower line |
| Stop loss | 148.15 | 30 pips below the lower line |
| Risk | 30 pips | 148.45 minus 148.15 |
| Target | 149.40 | just under the upper line |
| Reward | 95 pips | 149.40 minus 148.45 |
| Reward to risk | about 3.2 to 1 | 95 divided by 30 |
Because the lines slope, the target and stop levels at the time of entry are only a snapshot. The upper line will be higher by the time price gets there, so some traders adjust the target as the channel advances.
A trader risking 1% of a 3,000 USD account, which is 30 USD, with a 30-pip stop can work out the position from pip value. Check the figure with the lot size calculator and read risk per trade for the method.
Trade with the slope
Trades in the direction of the channel use the larger move as a tailwind. Buying the lower line of an ascending channel is a trend-following trade. Selling the upper line of an ascending channel is a counter-trend trade with the target at the lower line, and it has less room if the trend continues. Many beginners find that taking only with-slope trades gives fewer, cleaner setups.
What a break means
A channel ends when price closes clearly outside a line. Two things commonly follow:
- A move in the direction of the break, which can be fast. Price breaking below an ascending channel’s lower line may show the uptrend losing strength.
- A return into the channel, which is a false break. This is the fakeout problem and is why some traders wait for a close rather than a wick.
An old line often flips role after a break, with a broken support line acting as resistance on a retest. That is a tendency traders watch, not a rule, and we have no verified statistic for how often it holds.
Common problems
- Forcing the lines. If you have to stretch the lines to catch price, there is no channel.
- Too narrow. A channel 20 pips wide leaves almost no room after the spread. See trading costs.
- Stale lines. A channel drawn months ago on a chart that has since changed character gives no information.
- News. A major release can run through both lines. Check the economic calendar.
- Stops too tight. A stop a few pips outside the line is hit by normal noise. Using a volatility measure such as ATR helps set the distance.
Bottom line
A channel gives you two reference lines instead of one: a place to look for entries near one line and targets near the other. Draw it with a consistent rule, trade with the slope where you can, put the stop outside the line and expect some breaks to fail. Test the method on a demo account before using real money. Only risk money you can afford to lose. CFDs are complex, high-risk instruments.
Frequently asked questions
What is a channel in forex trading?
A channel is a pair of roughly parallel trend lines with price moving between them. The lower line acts as support and the upper line as resistance.
What are the three types of channel?
An ascending channel slopes up, a descending channel slopes down and a horizontal channel (also called a range) moves sideways.
How many touches make a valid channel?
Most traders want at least two touches on one line and one on the other before treating the lines as a channel. More touches make the lines more credible, though nothing guarantees price will respect them.
Where do traders put the stop loss in a channel trade?
Usually just outside the line that was used for the entry. If a long trade is taken at the lower line, the stop goes a little below it, since a close under the line means the channel may be failing.
What happens when price breaks out of a channel?
The channel is no longer valid. Price may reverse, accelerate in the direction of the break or return into the channel after a false break.
Is channel trading better with the trend?
Many traders prefer to take only trades in the direction of the channel, such as buying the lower line in an ascending channel. Trades against the slope are riskier because they trade into the larger move.