Forex Rectangle Pattern: How to Spot the Box and Trade the Breakout
Short answer: A rectangle is a sideways price box: price bounces between a flat support line and a flat resistance line, then eventually breaks out of one side. The height of the box gives a rough target for the move. The breakout can go either way and false breakouts are common, so wait for a candle close beyond the line and put the stop on the far side of the broken level.
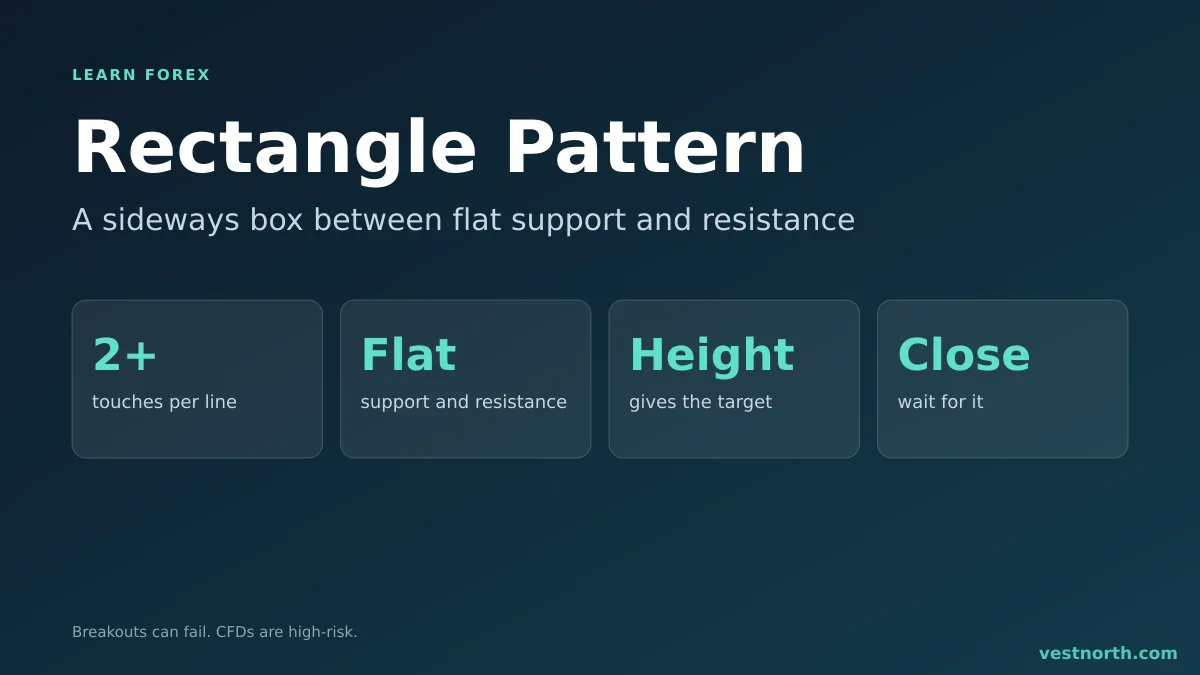
A rectangle and its breakout. Illustration, October 2026.
What a rectangle looks like
Two horizontal levels hold price in a box. Price rises to the top, turns down, falls to the bottom, turns up, and repeats. Sellers defend the top and buyers defend the bottom, and neither side wins for a while.
| Feature | What to look for |
|---|---|
| Top line | A flat resistance level touched at least twice |
| Bottom line | A flat support level touched at least twice |
| Height | Roughly constant. If the box narrows, it is a triangle |
| Slope | None. A tilted box is a channel or a wedge |
| Duration | Long enough to show repeated rejections, often several swings |
A rectangle is a tidy version of a range market. The pattern label adds one idea: the box is expected to end, and the breakout is the trade.
How to draw one
- Mark two or more swing highs that stop at about the same price and draw a horizontal line through them.
- Do the same for the swing lows.
- Check that price touched both lines more than once and that candles mostly stay between them.
- Decide whether you draw lines at wicks or at closes, and stay consistent.
- Measure the height from the top line to the bottom line. You need it for the target.
Levels are zones, not exact prices. A wick that pokes a few pips past the line does not cancel the box. A candle that closes well beyond it does.
A worked breakout trade
Invented numbers for illustration. On a EUR/GBP 1-hour chart, price moves between 0.8500 and 0.8550 for several days. The top has been touched three times and the bottom twice.
| Item | Level | Note |
|---|---|---|
| Box height | 50 pips | 0.8550 minus 0.8500 |
| Breakout level | 0.8550 | Wait for a candle close above it |
| Entry | 0.8556 | After the close, ignoring spread |
| Stop loss | 0.8530 | Back inside the box, 26 pips away |
| Target | 0.8600 | Breakout level plus the 50-pip height, 44 pips from entry |
Reward is 44 pips against 26 pips of risk, about 1.7 to 1. If your plan needs 2 to 1, the trade does not qualify as drawn. A tighter entry or a different target might fix it, or you skip the trade. The risk-reward ratio guide explains the sum, and the lot size calculator turns the 26-pip stop into a position size for your chosen risk.
For a downside break the same logic runs in reverse: enter after a close below the bottom line, put the stop back inside the box, and project the height downward.
Why rectangle breakouts fail
- False breakouts. Price closes just outside the box, then drops back in. See fakeouts.
- A thin move. A weak breakout candle with a long wick suggests the other side is still defending the line.
- News. A scheduled release can push price through the line with no link to the pattern. Check the economic calendar.
- Small box, wide spread. If the box is only 20 pips tall, the spread and slippage take a large share of a measured target.
- Another level close by. The projected target may run into a higher-timeframe level before it is reached.
- Drawing the box late. If you only see the rectangle after the breakout has started, the stop is far away and the target is close.
Ways to enter
Traders commonly use three entries. A breakout candle close beyond the line is a later entry with fewer early false moves. A pending stop order just outside the box fills earlier but is more exposed to spikes. A retest entry waits for price to come back to the broken line and hold it, which gives a tighter stop but may never trigger. See pending orders for how the orders work. Compare the options on past charts or a demo account before you use real money.
Trading inside the box
Some traders sell near the top and buy near the bottom while the box holds. This only works while the levels hold, and the stop must sit just beyond the line, because the same trade becomes a loss the moment the breakout arrives. It also needs a box tall enough to cover the spread twice. The approach is covered in the range market guide. If you are unsure which situation you are in, stand aside until the market shows its hand.
Bottom line
A rectangle is two flat lines and a pause. Draw the lines from repeated touches, wait for a close beyond one, place the stop back inside the box, and check that the measured target pays enough for the risk. Treat the direction as unknown until price chooses, and expect some false moves. Only risk money you can afford to lose. CFDs are complex, high-risk instruments.
Frequently asked questions
What is a rectangle pattern in forex?
It is a chart pattern where price moves sideways between a flat support line and a flat resistance line. Traders watch for a breakout through either side.
How many touches does a rectangle need?
Most traders want at least two touches on the top and two on the bottom before they call it a rectangle. More touches make the levels better defined.
Is a rectangle a continuation or a reversal pattern?
It can be either. Many traders read it as a pause in a trend, but price can also break the other way. Without verified statistics to quote, do not assume the direction before the breakout.
How do you set a target for a rectangle breakout?
A common method measures the height of the box and adds it to the breakout level, or subtracts it for a downside break. Treat it as a rough guide and check for nearby support and resistance.
What is the difference between a rectangle and a range market?
They describe the same sideways behaviour. 'Rectangle' usually means a tidy, well-defined box that a trader draws as a pattern, while 'range' is the general term for any sideways market.
Where should the stop loss go on a rectangle trade?
Many traders place it inside the box or just beyond the opposite side, so that a return into the box signals the breakout has failed. The right distance depends on your plan and the pair's volatility.