Forex Triangle Patterns: Ascending, Descending and Symmetrical, With a Worked Trade
Short answer: A triangle is a price range that narrows between two converging trend lines, with a breakout expected at some point. An ascending triangle has a flat top and rising lows, a descending triangle has a flat bottom and falling highs, and a symmetrical triangle has both lines sloping inward. The breakout can go either way and often fails, so place a stop loss beyond the opposite side of the pattern.
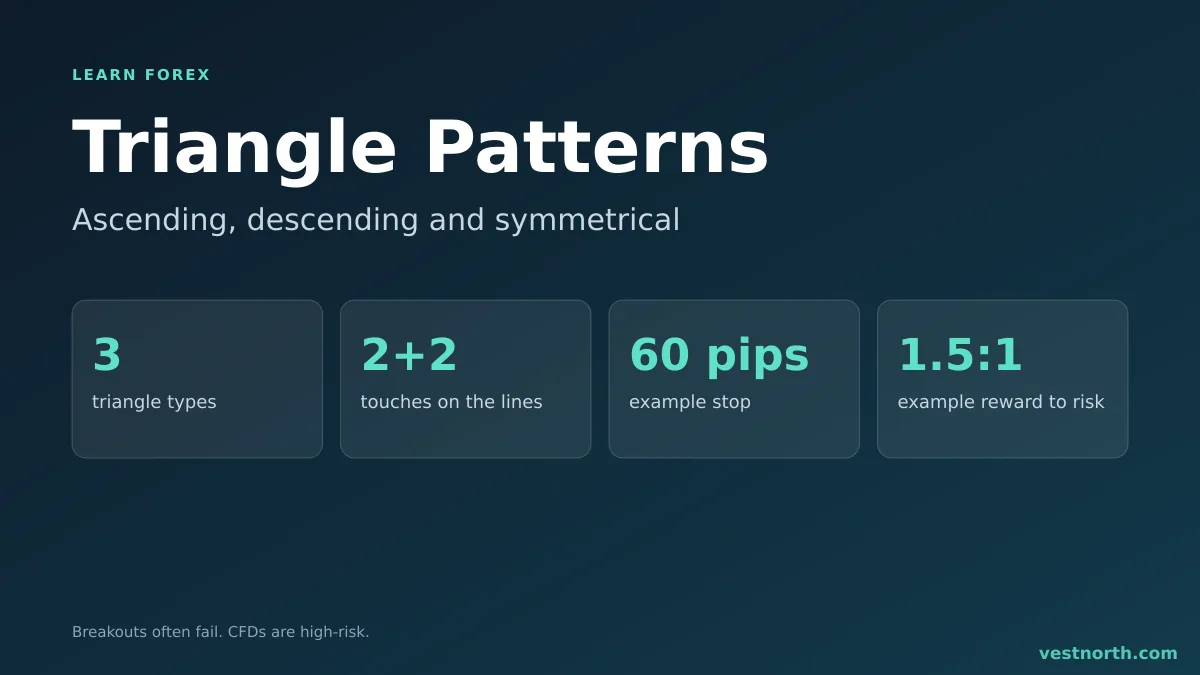
The three triangle types. Illustration, October 2026.
The three types
| Type | Upper line | Lower line | What traders read into it |
|---|---|---|---|
| Ascending | Flat (resistance) | Rising | Buyers push higher lows into a ceiling. Often watched for an upward break |
| Descending | Falling | Flat (support) | Sellers push lower highs into a floor. Often watched for a downward break |
| Symmetrical | Falling | Rising | Indecision. No built-in lean either way |
The lean in the first two is a habit of reading, not a rule. A flat ceiling can hold and send price down, and a flat floor can hold and send price up. Draw the lines, then wait for the market to choose.
How to draw one
- Find at least two swing highs and two swing lows after a clear move.
- Connect the highs with one line and the lows with another. They must converge.
- Check that swings are shrinking. If the ranges are not getting smaller, it is a channel or a range market.
- Note the height of the triangle at its widest point, which you will need for the target.
- Mark the level where the lines would meet. Breakouts that come close to the tip often have little room left.
Lines are rarely exact. Use wicks or closes consistently, and do not redraw them after every candle to fit what you hope to see.
A worked trade
Invented numbers for illustration. On a GBP/USD 4-hour chart, price forms an ascending triangle: the top touches 1.2700 three times, and the lows rise from 1.2600 to 1.2640 to 1.2670.
| Item | Level | Note |
|---|---|---|
| Triangle height | 100 pips | 1.2700 minus 1.2600 |
| Breakout level | 1.2700 | Wait for a candle close above it |
| Entry | 1.2710 | After the close, ignoring spread |
| Stop loss | 1.2650 | Below the last higher low, 60 pips away |
| Target | 1.2800 | Breakout level plus the 100-pip height; 90 pips from entry |
Reward is 90 pips against 60 pips of risk, a ratio of 1.5 to 1. If your plan wants 2 to 1, this trade does not qualify, which is a good reason to know that before you enter. With a 50 USD risk, the pip value must be 50 divided by 60, about 0.83 USD per pip, roughly 0.08 lot. The lot size calculator checks the sum, and risk-reward ratio explains the ratio.
Why triangle breakouts fail
- False breakouts. Price pokes through a line and falls back inside. See fakeouts.
- News. A scheduled release can break the pattern without any link to the chart. Check the economic calendar.
- Late entry. If the breakout candle is already large, the stop is far away and the target is close.
- A level in the way. The measured target may run into support and resistance before it is reached.
- Wide spread. Breakout moments often have wider spreads and slippage, which worsen the fill.
- Forcing the pattern. Many shapes look like triangles after the fact. If you must squint, skip it.
Entry styles
Traders use a few ways to enter: a breakout candle close beyond the line, a pending stop order just outside the pattern, or a wait for a retest of the broken line. Each has a cost. The close gives a later entry, a pending order is more exposed to false moves, and a retest may never come. See pending orders. Test your choice on past charts or a demo account first.
Related chart patterns and levels: the head and shoulders pattern, round-number levels and flag and pennant patterns.
Bottom line
A triangle shows price squeezing between two lines before a possible breakout. The three types differ in their lines, not in a guaranteed outcome. Wait for a close beyond a line, put the stop on the other side of the pattern, work out the position size from the stop distance, and check the reward against the risk before you enter. Only risk money you can afford to lose. CFDs are complex, high-risk instruments.
Frequently asked questions
What is a triangle pattern in forex?
A triangle is a chart pattern where price swings get smaller between two converging trend lines. Traders watch for a breakout through either line.
What are the three types of triangle?
An ascending triangle has a flat top and rising lows. A descending triangle has a flat bottom and falling highs. A symmetrical triangle has falling highs and rising lows.
Do triangles always break out in the direction of the trend?
No. Triangles are often described as continuation patterns, but they can break either way. We have no verified statistics to quote, so do not assume the direction before the breakout.
How many touches does a triangle need?
Most traders want at least two touches on each trend line, so four points in total. More touches make the lines more reliable, but a very long triangle can also lose force.
How do you set a target for a triangle breakout?
A common method measures the height of the triangle at its widest point and adds it to the breakout level. Treat it as a rough guide and check for nearby support and resistance.
What is a false breakout from a triangle?
It is a move beyond a trend line that quickly returns inside the triangle. Waiting for a candle close beyond the line reduces some of them but does not remove them.