Head and Shoulders Pattern in Forex: Structure, Neckline and Targets
Short answer: A head and shoulders is a three-peak chart pattern: a left shoulder, a higher head and a right shoulder at a similar height to the left. The line joining the two lows between the peaks is the neckline. Traders treat a candle close below the neckline as a possible reversal from an uptrend to a downtrend, and a common target is the head-to-neckline distance projected down from the break.
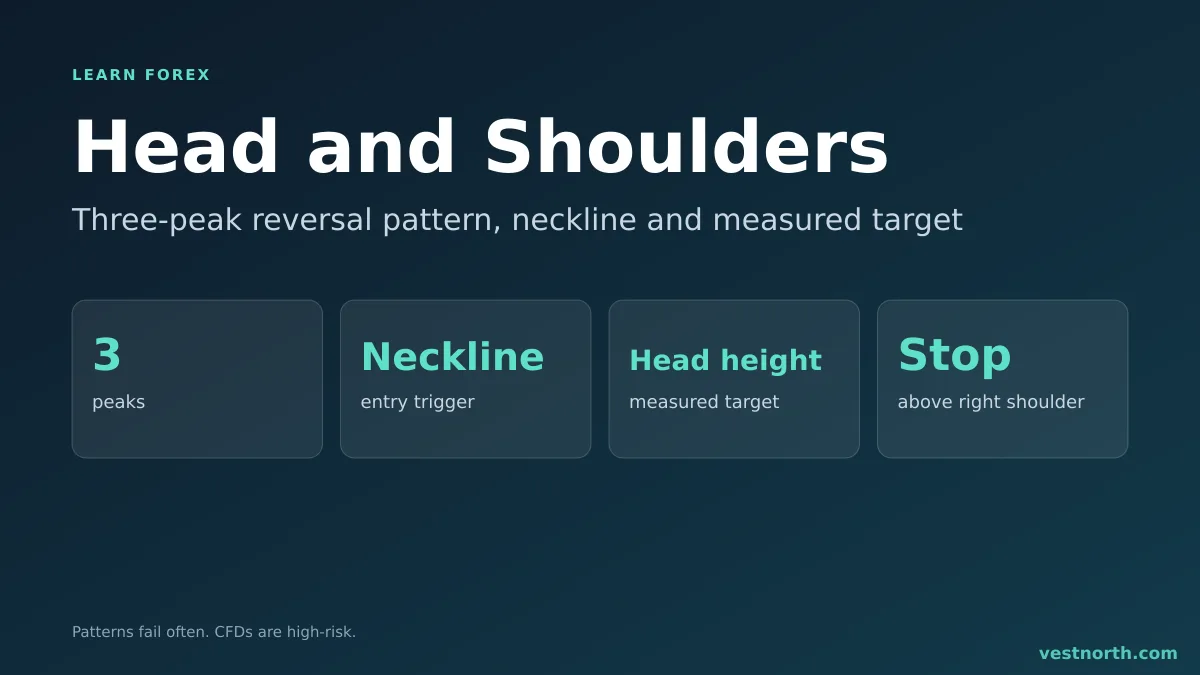
The pattern in four parts. Illustration, October 2026.
The structure
The pattern needs an uptrend first. Without a prior rise there is nothing to reverse.
- Left shoulder: price makes a high, then pulls back.
- Head: price rises above the left shoulder, then falls back to roughly the same level as the first pullback.
- Right shoulder: price rises again but stalls near the height of the left shoulder, below the head.
- Neckline: a line through the two pullback lows. It can be flat or sloped.
The pattern is only a possibility until price closes beyond the neckline. Until then, it is three bumps on a chart, and the market may simply continue up.
Some traders also look for volume to fall on the right shoulder. Spot forex has no central volume figure, and a broker’s tick volume only reflects that broker’s own feed, so treat volume clues with caution.
How to trade it
There are two common entries.
- Break entry: sell after a candle closes below the neckline. You enter earlier, but you also catch false breaks.
- Retest entry: wait for price to come back up to the neckline and fail. You get a tighter stop and a better ratio, but the retest may never happen and you miss the move.
The stop goes where the idea is wrong. Above the right shoulder is closer, so the lot can be larger for the same dollar risk, but noise can reach it. Above the head is wider and safer from noise, so the lot must be smaller.
The target is the measured move: the distance from the head to the neckline, projected down from the breakout. It is a rule of thumb. Price often stops short of it or runs past it.
A worked example
Suppose GBP/USD rallies to 1.2800 (left shoulder), falls to 1.2700, rises to 1.2900 (head), falls back to 1.2700 and rises to 1.2810 (right shoulder). The neckline is flat at 1.2700.
Price closes at 1.2690 on the daily chart. A trader sells at 1.2690 with the stop at 1.2830, above the right shoulder, a risk of 140 pips. The head is 200 pips above the neckline (1.2900 minus 1.2700), so the measured target is 1.2500, 190 pips below the entry.
| Item | Value |
|---|---|
| Entry | 1.2690 |
| Stop | 1.2830 (140 pips) |
| Target | 1.2500 (190 pips) |
| Reward to risk | about 1.36 to 1 |
On a 0.05 lot, one pip of GBP/USD is worth about $0.50, so a full stop costs about $70 before spread and slippage. A retest entry at 1.2700 with the same stop would risk 130 pips for a 200-pip target, which is about 1.5 to 1. These prices are invented for the example. Our risk-reward ratio guide explains why a 1.36 ratio needs a win rate above about 42% to break even, before costs.
Inverse head and shoulders
Flip everything. Price falls in a downtrend, makes three troughs with the middle one lowest, and the neckline joins the two rebounds. A close above the neckline is read as a possible turn to the upside. The stop sits below the right shoulder or the head, and the target is the head-to-neckline distance projected upward.
Why many patterns fail
- Hindsight. Patterns are easy to see after the fact. Drawn live, a “right shoulder” can keep rising and become a new high.
- Uneven shoulders. Shoulders at very different heights, or a sharply sloped neckline, make the rules vague. Two traders will draw different lines on the same chart.
- Break and reverse. Price closes below the neckline, then returns above it. This is a fakeout, and a stop is what limits the loss.
- Too little room. If the target sits next to a strong support level, price may stall there. Check support and resistance before you enter.
- News. A data release can break the neckline in one candle and reverse it in the next. The economic calendar lists the times.
Related reversal patterns
The head and shoulders is a cousin of the double top and double bottom, which have two peaks instead of three. Both rely on a neckline-style trigger, which is a breakout of a level that held before. Both give back part of their edge once spread and slippage are counted.
Practise spotting the pattern in past charts and on a demo account before using money. A demo does not reproduce real-market slippage.
Bottom line
A head and shoulders is a structure, a neckline and a measured target. It becomes a trade only when a candle closes beyond the neckline, and it needs a stop placed where the pattern is wrong. Size the lot from that stop distance, expect some patterns to fail, and risk only money you can afford to lose. CFDs are complex, high-risk instruments.
Frequently asked questions
What is a head and shoulders pattern?
It is a chart pattern with three peaks, where the middle peak (the head) is higher than the two outer peaks (the shoulders). A close below the neckline joining the two lows is read as a possible trend reversal from up to down.
What is an inverse head and shoulders?
It is the mirror image: three troughs with the middle one lowest. A close above the neckline is read as a possible reversal from down to up.
How do you calculate the target of a head and shoulders?
Measure the distance from the head to the neckline and project it from the breakout point. If the head is 100 pips above the neckline, the target is about 100 pips below it.
Where does the stop loss go?
Common choices are above the right shoulder or above the head. The right shoulder gives a smaller risk but a higher chance of being hit by noise.
How reliable is the head and shoulders pattern?
Not reliable enough to trade without a stop. Many patterns never complete, and some neckline breaks reverse. Treat it as a setup, not a guarantee.
Which timeframe is best?
Patterns on higher timeframes such as the 4-hour and daily charts usually take longer to form and are less affected by spread and noise. Short timeframes produce many look-alikes.