Double Top and Double Bottom Patterns in Forex
Short answer: A double top forms when price hits the same high twice and fails, and a double bottom forms when price hits the same low twice and holds. Neither is a signal until price breaks the neckline, which is the low between the two highs (or the high between the two lows). A common plan is to enter after the neckline breaks, place the stop beyond the second peak, and project the pattern’s height from the neckline for the target. Many patterns fail, so size the trade by the stop distance.
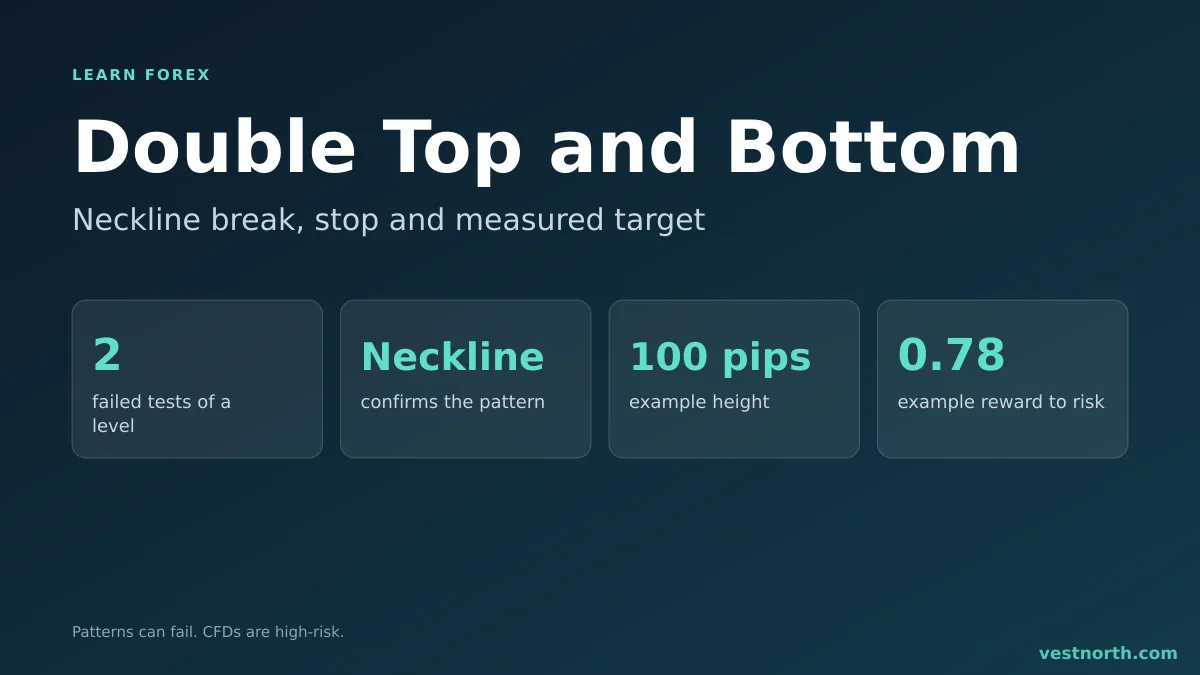
The two patterns and the neckline rule. Illustration, October 2026.
What the pattern says
Both patterns show a level that the market tried twice and could not pass.
- Double top (the letter M): buyers push price up to a resistance level, sellers push it back, buyers try again and fail at about the same price. The second failure suggests buying pressure is fading.
- Double bottom (the letter W): sellers push price down to a support level, buyers bounce it, sellers try again and fail. The second failure suggests selling pressure is fading.
The pattern only matters after a prior trend. A double top needs an uptrend to reverse, and a double bottom needs a downtrend. In a sideways market, two similar highs are just part of a range.
These patterns are built on support and resistance, so it helps to know how those levels form first.
Anatomy of a double top
| Part | What it is | Example (EUR/USD) |
|---|---|---|
| First peak | The high before the first pullback | 1.1000 |
| Neckline | The lowest point of the pullback between the peaks | 1.0900 |
| Second peak | A retest of the first high, within a few pips | 1.0995 |
| Confirmation | A candle close below the neckline | Close at 1.0890 |
| Height | First peak minus neckline | 100 pips |
A double bottom is the same shape upside down: two lows at about the same price, a neckline at the high between them, and confirmation by a close above the neckline.
The peaks do not have to match to the pip. Many traders accept a difference of a few pips on a pair that moves 80 pips a day, which is why the ATR helps in judging “close enough”.
Why wait for the neckline
Price can touch the same level twice and then keep rising. Entering at the second peak means betting on a reversal that has not happened. Entering after a close below the neckline means the market has already shown it will go lower than the pullback low.
The cost of waiting is a worse entry price and a smaller move left to the target. The cost of not waiting is more failed trades. Neither choice is free, and that trade-off belongs in your trading plan.
A worked double top trade
All prices below are an invented example.
- EUR/USD rallies to 1.1000 (first peak), falls to 1.0900 (neckline), then rallies to 1.0995 (second peak) and falls again.
- A candle closes at 1.0890, below the neckline. The pattern is confirmed.
- Entry: sell at 1.0890.
- Stop loss: above the second peak with a 10-pip buffer, at 1.1005. That is 115 pips from entry.
- Target: the height is 100 pips (1.1000 minus 1.0900), projected down from the neckline to 1.0800. That is 90 pips from entry.
This is a problem to notice before trading: the risk is 115 pips and the reward is 90 pips, a reward-to-risk ratio of about 0.78. A setup like this does not pay unless it wins far more often than it loses. See risk-reward ratio. Options are to skip it, to look for a retest entry nearer the neckline that shrinks the stop, or to use a shorter pattern on a lower timeframe.
Sizing the trade
If you risk $100 and the stop is 115 pips on EUR/USD (pip value $10 per lot), the lot size is 100 ÷ (115 × 10) = about 0.087 lot, which most brokers will round to 0.08 or 0.09 depending on the lot step. The lot size calculator does this for any pair, and position sizing explains the rule.
The retest entry
After breaking the neckline, price often comes back to touch it from below (for a double top) before moving on. The old support has turned into resistance. Some traders wait for this retest and enter on a rejection there, which gives a closer stop above the neckline. The risk is that price may never retest and the move leaves without you.
Double bottom checklist
For a double bottom, flip everything:
- Prior downtrend into the first low.
- Second low within a few pips of the first.
- Candle close above the neckline.
- Stop below the second low, with a buffer.
- Target equals the height projected up from the neckline.
What makes a pattern weaker
- No prior trend. Two highs inside a range often resolve as noise.
- Peaks far apart in time. The more candles between them, the less they relate.
- A neckline break on a weak candle, or one that happens right at a news release when spreads widen.
- A second peak that clearly breaks the first. If price closes well above the first peak, treat it as a breakout, not a double top.
- A break that is quickly reversed. That is a fakeout, and it is why a stop is not optional.
Common mistakes
- Selling at the second peak before any confirmation.
- Placing the stop inside the pattern, where normal noise reaches it.
- Ignoring the reward-to-risk ratio because the measured target looks big on the chart.
- Drawing the pattern after the fact. On a finished chart every high looks like a double top. Rules must be fixed before the trade.
- Trading it against a strong higher-timeframe trend. A double bottom in a steep daily downtrend has a lower chance of working.
Bottom line
A double top or bottom is two failed attempts at the same level, and it counts only after the neckline breaks. Place the stop beyond the second peak, project the height for the target, and check the reward-to-risk ratio before you click. Many of these patterns fail, so let the stop distance set your lot size. Only risk money you can afford to lose, because leveraged CFDs can lose value quickly.
Frequently asked questions
What is a double top in forex?
A double top is a reversal pattern where price rises to a high, pulls back, rises to about the same high again and fails. It is confirmed when price closes below the low of the pullback, called the neckline.
What is a double bottom?
It is the mirror image: price falls to a low, bounces, falls to about the same low and holds. It is confirmed when price closes above the high of the bounce.
How do I set the target for a double top?
A common method is to measure the height from the peaks to the neckline and project that distance down from the neckline. With peaks at 1.1000, a neckline at 1.0900 and a height of 100 pips, the target is 1.0800.
Where does the stop loss go?
Many traders put it just above the second peak for a double top and just below the second trough for a double bottom. Adding a buffer such as the pair's ATR avoids being stopped by noise.
Do double tops always lead to a reversal?
No. Many fail, and price breaks through the same level and continues. That is why the neckline break and a stop loss matter. No pattern has a guaranteed result.
Which timeframe works best?
The pattern appears on every timeframe. Larger timeframes such as the 4-hour and daily charts give fewer but cleaner patterns. Lower timeframes give more signals and more false ones.