Forex Trend Lines: How to Draw Them, Trade Bounces and Breaks
Short answer: A trend line is a straight line drawn through two or more swing lows in an uptrend (price stays above it) or two or more swing highs in a downtrend (price stays below it). A third touch is the usual test that the market respects the line. Traders buy or sell bounces off it, and treat a candle close beyond it as a warning that the trend may be changing. It is a judgement tool, so two traders can draw slightly different lines on the same chart.
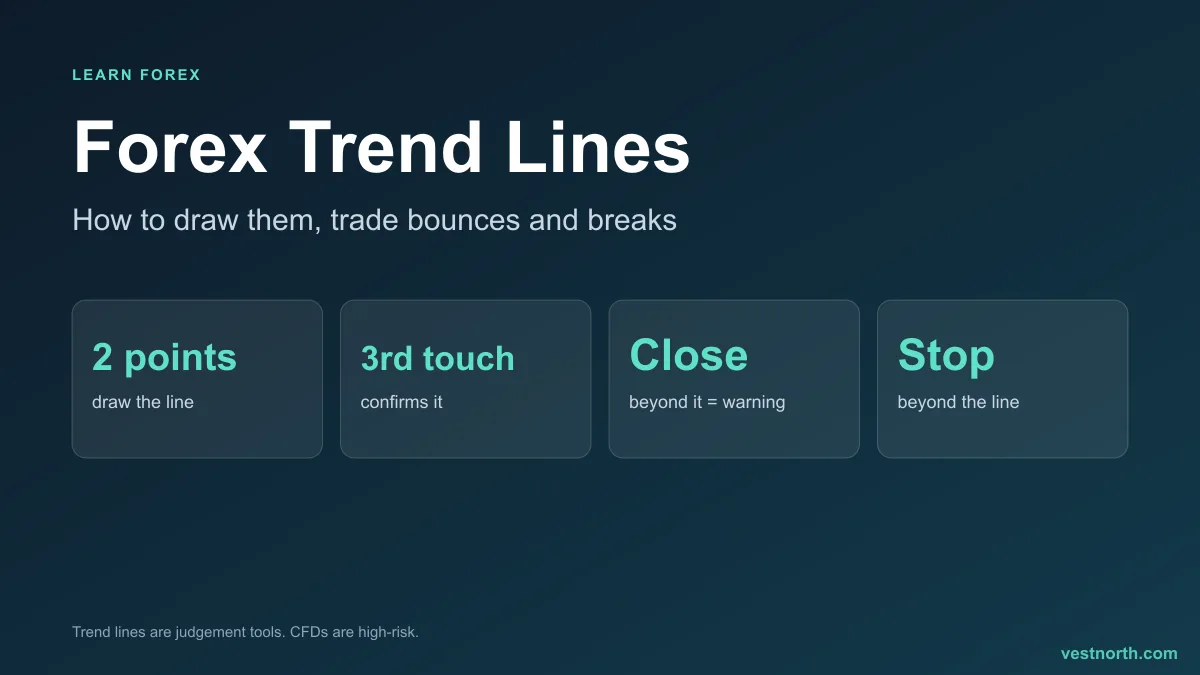
Trend line anatomy. Illustration, November 2026.
What a trend line is
A trend is a series of higher highs and higher lows (uptrend) or lower highs and lower lows (downtrend). A trend line makes that slope visible. The rising line under an uptrend marks where buyers have stepped in before, so many traders watch it as dynamic support. The falling line over a downtrend works the same way as dynamic resistance.
It is “dynamic” because the price of the line changes each candle. A horizontal level stays at 1.0800. A trend line might be at 1.0800 now and 1.0830 ten candles later. For flat levels, see support and resistance; for the trend itself, see trend trading basics.
How to draw a trend line
- Find the trend. Zoom out first. A line on a chart that is moving sideways has nothing to describe, and that is a job for a range instead.
- Mark two swing points. In an uptrend, pick two clear swing lows. In a downtrend, two swing highs. Start with the earliest obvious points.
- Draw the line. Extend it to the right. Price should stay on one side of the line between the two points, not cut through candles.
- Wait for the third touch. A line with two points is a hypothesis. A third touch, where price comes back, reacts and moves away, is the first real evidence.
- Adjust, but do not force it. If price pierces the line with a wick and closes back, many traders redraw through the wick. If you have to redraw every few candles, the trend may be gone.
What makes a line more reliable
| Feature | Stronger | Weaker |
|---|---|---|
| Touches | Three or more clean reactions | Only the two points used to draw it |
| Spacing | Touches spread over many candles | All touches bunched together |
| Slope | Moderate angle | Very steep line, usually breaks soon |
| Timeframe | 4-hour, daily or weekly | 1-minute or 5-minute |
| Length | Holds for dozens of candles | Drawn over a handful of candles |
A very steep line is a warning sign. Price rising at a sharp angle is hard to sustain, and when the line breaks the move often settles into a flatter slope instead of reversing.
Two ways to trade a trend line
1. Trade the bounce
Price falls back to a rising line, forms a rejection candle such as a pin bar or a hammer, and starts to rise again. The trade follows the trend, so the stop is easy to place: just below the line and the last swing low.
2. Trade the break
A close beyond the line is the first sign that the trend may be ending. Many traders wait for the candle to close, and some wait for a retest of the broken line from the other side. A fast spike through the line that closes back inside is a fakeout, not a break.
A broken uptrend line does not mean the price will fall. It can mean the market has gone sideways, or that a flatter line will form from the new lows.
Worked example (illustrative figures)
On a 4-hour EUR/USD chart, price makes swing lows at 1.0720 and 1.0765, then a third low near 1.0810 that touches the rising line and bounces. A pin bar forms with a low of 1.0804 and a close at 1.0822.
| Item | Level | Distance |
|---|---|---|
| Entry (above the pin bar high) | 1.0824 | |
| Stop (below the line and pin bar low, plus spread) | 1.0794 | 30 pips |
| Target (previous swing high) | 1.0914 | 90 pips |
| Reward to risk | 3 to 1 |
With a 5,000 USD account risking 1% (50 USD), a 30-pip stop allows about 1.67 USD per pip, roughly 0.17 lot on a pair where 1 pip is 10 USD per lot. Use the lot size calculator for your own numbers. These levels are made up for the example and are not a signal.
Why trend lines fail
- Hindsight lines. On a finished chart a good line is obvious. In real time you choose from several possible lines.
- Too many redraws. A line moved after each break always fits the past and predicts little.
- Crowded lines. A line tested many times attracts many traders, and by the fifth touch a lot of stops may sit just beyond it.
- News spikes. A data release can drive price through any line. Check the economic calendar before holding a trade through an event.
- Choppy markets. In a sideways market, lines break every few candles because there is no trend to follow.
Combining trend lines with other tools
Trend lines work best with a second reason: a horizontal level, a Fibonacci retracement level, or a higher timeframe pointing the same way. A parallel line drawn through the opposite swing points forms a channel. We have no verified statistic for how often a trend line bounce works, so test your own rules on a demo account and log every trade.
Bottom line
A trend line joins swing lows in an uptrend or swing highs in a downtrend and projects the slope forward. Two points draw it, a third touch tests it, and a candle close beyond it is a warning. Trade the bounce with a stop beyond the line, or wait for a confirmed break and a retest. Expect false breaks and fit the position to the stop. Only risk money you can afford to lose. CFDs are complex, high-risk instruments.
Frequently asked questions
How do you draw a trend line in forex?
In an uptrend, connect two or more swing lows with a straight line, with price staying above it. In a downtrend, connect two or more swing highs, with price staying below. Two points create the line, and a third touch confirms that the market respects it.
How many touches make a trend line valid?
Two points are needed to draw the line and a third touch is the usual test that it matters. More touches make the line better known, but each touch also wears it out, so an old, often-tested line can break at any time.
Should I draw trend lines through wicks or candle bodies?
Either works if you stay consistent. Wicks show the extreme prices reached, bodies show where candles closed. Many traders use wicks and accept that the line is a zone a few pips wide, not an exact price.
Which timeframe is best for trend lines?
Lines drawn on higher timeframes such as the 4-hour and daily chart are watched by more traders and break less often on noise. Lower timeframes give more lines but also more false breaks.
What is a trend line break?
A break happens when a candle closes clearly on the other side of the line. Many traders wait for the close, and some also wait for a retest of the broken line, because a spike through the line that reverses is common.
Do trend lines work as support and resistance?
They act like sloping support in an uptrend and sloping resistance in a downtrend. The difference from a horizontal level is that the price of the line changes with every candle.
Where should the stop loss go on a trend line trade?
Usually just beyond the line and the last swing point, so that a real break closes the trade. Size the position from that distance, not the other way round.