Fibonacci Retracement in Forex: Basics for Beginners
Short answer: Fibonacci retracement is a chart tool that splits a price swing into percentage levels, most often 38.2%, 50% and 61.8%. Traders watch those levels as places where a pullback in a trend might pause. They are reference points, not guarantees, so every trade still needs a stop loss placed beyond the swing.
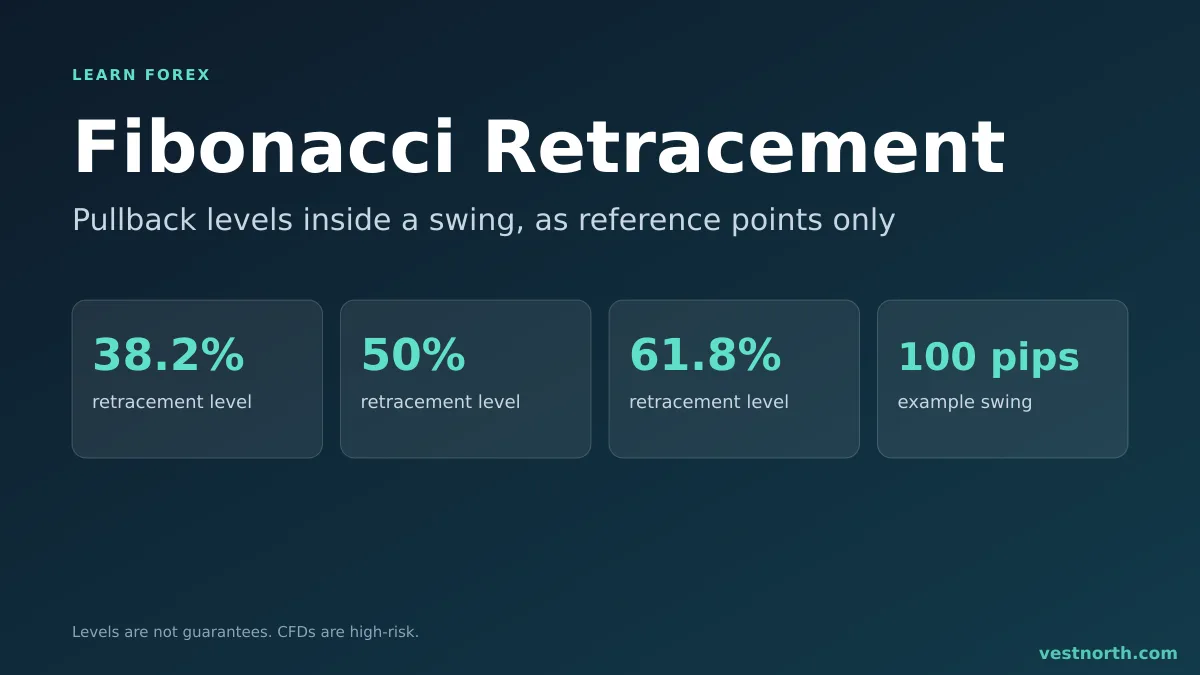
A Fibonacci retracement drawn on an uptrend swing. Illustration, October 2026.
What the tool does
Inside a trend, price moves, falls back part of the way, then moves again. The part of the way it falls back is the retracement. The Fibonacci tool draws horizontal lines at set percentages of the previous swing, so you can see how far a pullback has gone and where traders might be watching.
The ratios come from the Fibonacci number sequence. Most platforms show 23.6%, 38.2%, 50%, 61.8% and 78.6%. The 50% line is not a true Fibonacci ratio, but platforms include it because the halfway point is widely watched. No source proves that price respects these levels, and they work only to the extent that many traders use them.
How to draw it
- Identify the trend first. See trend trading basics.
- Pick a clear swing: the move from the last swing low to the swing high in an uptrend.
- Select the Fibonacci retracement tool on your charting platform.
- Click the swing low, drag to the swing high and release. In a downtrend, start at the high and end at the low.
The platform fills in the levels. If it draws them upside down, you started from the wrong end.
A worked example
EUR/USD rises from 1.0800 to 1.0900, a swing of 100 pips. The levels are:
| Level | Distance from the high | Price |
|---|---|---|
| 23.6% | 24 pips | about 1.0876 |
| 38.2% | 38 pips | about 1.0862 |
| 50% | 50 pips | 1.0850 |
| 61.8% | 62 pips | about 1.0838 |
| 78.6% | 79 pips | about 1.0821 |
Price falls toward 1.0850, the 50% level, and a bullish candle closes at 1.0855. You buy there with a stop at 1.0795, just under the swing low, a risk of 60 pips. A target at the old high of 1.0900 is 45 pips away, which is less than the risk. Pairing this entry with a target past the high, at 1.0975 for example, gives 120 pips of reward, but that means the idea needs a new high.
For a $5,000 account risking 1% ($50), the lot size is $50 ÷ (60 × $10) = about 0.08 lot. Use the lot size calculator to check, and risk to reward to test the plan before you enter.
Making the levels more useful
A Fibonacci level on its own is weak. Traders often look for confluence, which means more than one reason at the same price:
- A Fibonacci level that lines up with an old support or resistance area.
- A level near a moving average that price has respected.
- A bullish candlestick closing at the level.
Even then, price can slice through. Two traders who pick different swing points will draw different levels, which is one reason the tool is subjective.
Limits and risks
- The result depends on which swing you choose. Drawing it after the fact will always make the levels look accurate.
- Price can pass 61.8% and keep falling. That is a reversal, not a failed tool.
- Stops placed exactly at a Fibonacci line are close to where many others place theirs, which makes a fakeout more costly.
- Fast moves can cause slippage, so a stop may fill worse than planned.
Common mistakes
- Drawing the tool on a downtrend and expecting a bounce to hold.
- Trading a Fibonacci level with no stop.
- Changing the swing points until the levels fit.
- Using it in a range with no trend.
Practise on a demo account, and keep a trading journal of which levels held and which did not.
Bottom line
Fibonacci retracement gives you a set of percentage levels inside a swing, and many traders watch them. It tells you nothing about what price will do. Use it with a clear trend and a second reason, put the stop beyond the swing, and set lot size from that stop distance. CFDs are complex, high-risk instruments, so only trade money you can afford to lose.
Frequently asked questions
What is Fibonacci retracement in forex?
It is a charting tool that divides a price swing into percentage levels, usually 23.6%, 38.2%, 50%, 61.8% and 78.6%. Traders watch them as possible places where a pullback may pause.
How do you draw Fibonacci retracement?
In an uptrend, drag the tool from the swing low to the swing high. In a downtrend, drag it from the swing high to the swing low. The platform then draws the levels between the two points.
Is 50% a Fibonacci number?
No. The 38.2%, 61.8% and other ratios come from the Fibonacci sequence, but 50% is added by most platforms because traders watch the halfway point of a move.
Do Fibonacci levels always work?
No. Price often passes through them, and different traders pick different swing points, so the levels move. They are reference points, and not guaranteed reversal levels.
Where should I put the stop loss on a Fibonacci trade?
A common choice is beyond the swing point you drew from, or beyond the next level. If price passes the start of the swing, the trend idea is probably wrong.
Which swing should I use?
Use a clear, recent swing that you can see without zooming in. Two traders using different swings will get different levels, so check whether the levels line up with support or resistance.