What Is a Hammer Candle in Forex? How to Spot It, Trade It and Avoid False Signals
Short answer: A hammer is a candle with a small body near the top and a long lower wick, at least about twice the body, that forms after a decline. It shows sellers pushed price down but buyers pushed it back before the close. It is a possible reversal clue, not a guaranteed one, and it matters most at a level such as support.
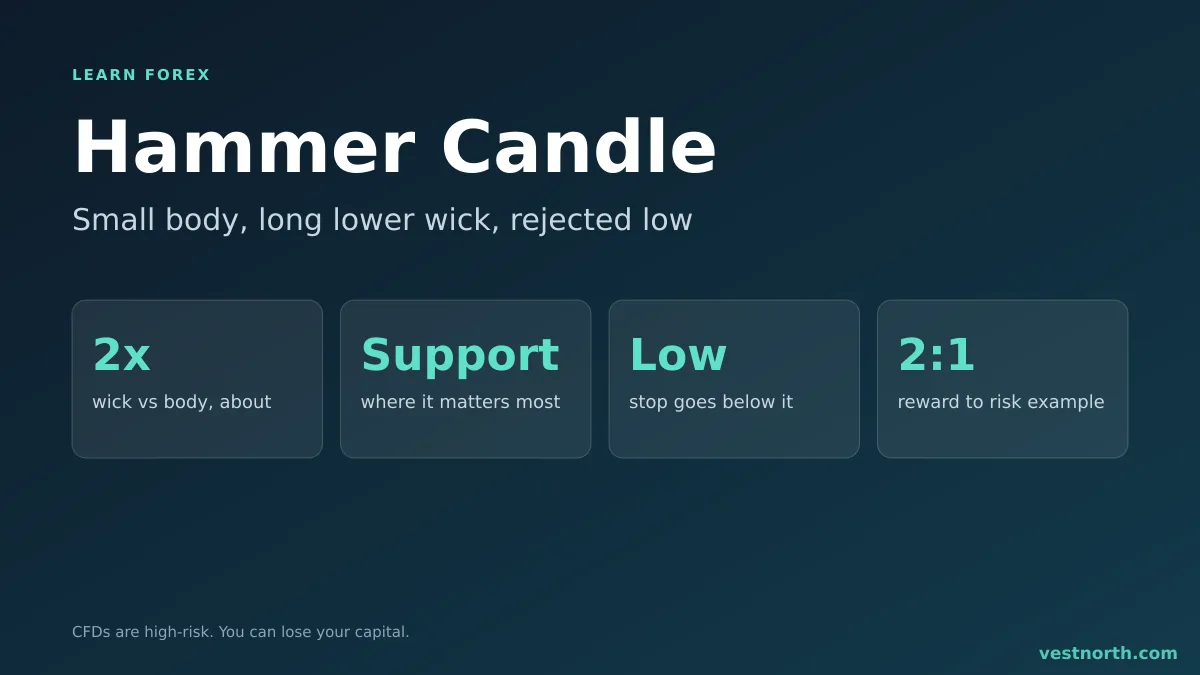
Anatomy of a hammer. Illustration, October 2026.
What a hammer looks like
Candles have a body (open to close) and wicks (the high and low reached). A hammer has three features:
- A small body in the upper part of the candle’s range.
- A lower wick about two or more times the size of the body.
- Little or no upper wick.
The name comes from the shape: the wick is the handle and the body is the head. The same shape appearing after a rise is called a hanging man, which traders read as a possible warning of a fall. See candlestick basics for how to read bodies and wicks.
The story the hammer tells
During the candle, sellers drove price well below the open. Buyers then took control and pushed it back near the open or higher. The long wick marks the price area that was rejected.
That is why location matters. A hammer in the middle of nowhere is just a candle with a long wick. A hammer at a support level, at the end of a pullback in an uptrend or at a retracement zone is a stronger clue, because the rejection happened where buyers were already expected.
Hammer, pin bar and doji
| Candle | Shape | Typical reading |
|---|---|---|
| Hammer | Small body on top, long lower wick | Possible bullish reversal after a fall |
| Hanging man | Same shape after a rise | Possible bearish warning |
| Pin bar | Small body, one long tail, either direction | Rejection of a level |
| Doji | Open and close almost equal | Indecision |
A bullish pin bar and a hammer are close to the same thing. The word hammer is more common in candlestick-pattern books, and pin bar in price-action trading.
How to trade a hammer
There is no single correct method. This is a common outline:
- Context. The hammer forms after a decline, ideally at support or the end of a pullback within an uptrend.
- Confirmation. Wait for the next candle to close above the hammer’s high. This delays the entry and removes some false signals.
- Entry. Buy above the hammer’s high, or on the close of the confirming candle.
- Stop. Place it below the hammer’s low, plus a buffer for the spread. A break of the low means the rejection failed.
- Target. Use the next resistance level or a multiple of the risk. See the risk-reward ratio.
Worked example
On a 4-hour AUD/USD chart, price falls into a support zone near 0.6500 and prints a hammer with a low of 0.6462 and a high of 0.6510. The next candle closes at 0.6522.
| Item | Level | Distance |
|---|---|---|
| Entry (confirming close) | 0.6522 | |
| Stop (below hammer low) | 0.6455 | 67 pips |
| Target | 0.6656 | 134 pips |
| Reward to risk | 2 to 1 |
With a 1,500 USD account risking 1% (15 USD), a 67-pip stop calls for about 0.22 USD per pip. Use the lot size calculator for the lot size and position sizing for the method. If the stop is too wide for your risk limit, skipping the trade is a valid decision. The figures are illustrative.
Waiting for confirmation gave up 12 pips compared with buying at the hammer’s high. That is the price of fewer false signals.
Why hammers fail
- No level. Price had nothing to bounce from, so the wick means little.
- Downtrend continues. A hammer inside a strong fall can be a pause, with sellers returning on the next candle.
- Hindsight. Finished charts show the hammers that worked. The ones that failed are easy to forget. We have no verified statistic for how often a hammer leads to a reversal, so treat success rates quoted online carefully.
- Wick caused by news. A spike during a data release reflects the event, not a level. Check the economic calendar.
- Tiny candles. A hammer only a few pips tall can be spread noise.
Using a hammer with other tools
Traders often require a second reason before acting: a trend line, a moving average, an engulfing candle after the hammer, or agreement from a higher timeframe. More conditions mean fewer trades, and fewer is not automatically better. Test any combination on a demo account and log the results.
Related candlestick patterns: the inverted hammer, three inside up and down and morning and evening stars.
Bottom line
A hammer is a small-bodied candle with a long lower wick after a decline, showing a rejected low. It carries more weight at a support level or the end of a pullback, and many traders wait for a confirming candle. Set the stop below the hammer’s low and size the position from that distance. Expect failures. Only risk money you can afford to lose. CFDs are complex, high-risk instruments.
Frequently asked questions
What is a hammer candle in forex?
A hammer is a single candle with a small body near the top of its range and a lower wick at least about twice the body. It appears after a decline and shows sellers pushed price down but buyers pushed it back.
What is the difference between a hammer and a hanging man?
They look the same. A hammer appears after a fall and is read as a possible bullish reversal. The same shape after a rise is called a hanging man and is read as a possible bearish warning.
Does the colour of a hammer matter?
Many traders prefer a bullish (closing higher) body because it shows a stronger recovery, but the shape and location matter more than the colour.
Is a hammer the same as a pin bar?
A bullish pin bar and a hammer are very similar, since both have a long lower tail and a small body. Pin bar is the broader term and is often used for rejection at any level, in either direction.
Should I buy as soon as a hammer closes?
Not necessarily. Many traders wait for the next candle to trade above the hammer's high as confirmation, accepting a later entry for fewer false signals.
Where does the stop loss go on a hammer trade?
Usually just below the low of the hammer, since a break of that low means the rejection failed. Size the position from that distance.