Morning Star and Evening Star Candle Patterns in Forex: How to Read and Trade Them
Short answer: A morning star is a three-candle bullish reversal that appears after a decline: a long bearish candle, a small-bodied candle, then a long bullish candle that closes well into the first candle’s body. An evening star is the same idea upside down, after a rise. Both are possible clues, not signals that guarantee a turn, and they matter most at a support or resistance level.
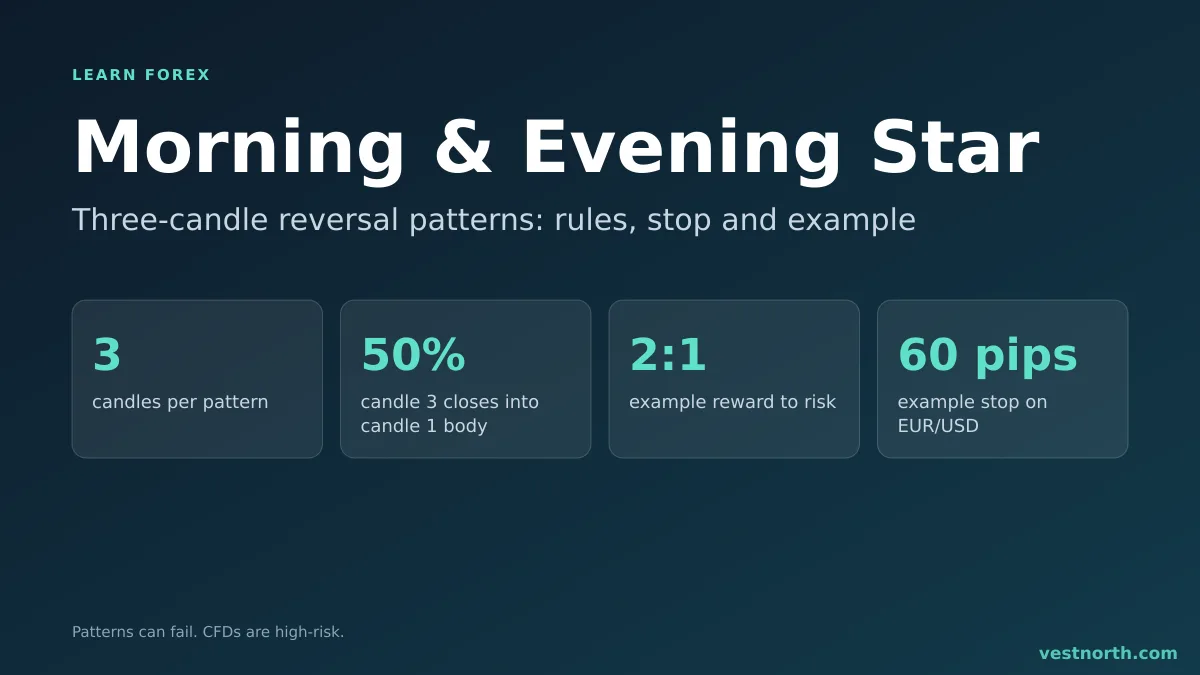
Both patterns side by side. Illustration, November 2026.
What a morning star looks like
Three candles in a row, after a clear fall:
- A long bearish candle. Sellers are in control.
- A small-bodied candle that sits near or below the first candle’s low. Price stalls. The candle can be a doji or a small spinning top, and its colour matters little.
- A long bullish candle that closes at least halfway up the body of the first candle.
The story is a change of control. Sellers push price down, then lose momentum, then buyers take over. The name comes from the morning star (the planet Venus) that appears before sunrise, hinting at a new day after a dark night.
What an evening star looks like
Turn the picture over. After a rise:
- A long bullish candle.
- A small-bodied candle near or above the first candle’s high.
- A long bearish candle that closes at least halfway down the first candle’s body.
Traders read this as buyers running out of energy and sellers stepping in. The evening star is a possible warning for a long trade, or a possible entry for a short.
Quick reference
| Feature | Morning star | Evening star |
|---|---|---|
| Comes after | A decline | A rise |
| Candle 1 | Long bearish | Long bullish |
| Candle 2 | Small body, near the low | Small body, near the high |
| Candle 3 | Long bullish, closes into candle 1’s body | Long bearish, closes into candle 1’s body |
| Read as | Possible bullish reversal | Possible bearish reversal |
| Stop goes | Below the lowest low | Above the highest high |
Gaps between candles are part of the textbook definition. Forex trades almost around the clock on weekdays, so a literal gap is uncommon except at the weekend open. Most traders accept a second candle whose body sits clear of the first body, even without a gap. For how bodies and wicks are read, see candlestick basics.
Why location matters more than shape
A perfect three-candle shape in the middle of a range tells you very little. The same shape at a support level after a pullback, or at a resistance level after a sharp rise, has a reason behind it: buyers or sellers were already expected there.
Ask three questions before acting:
- Is there a level nearby that price has respected before?
- Was the move into the pattern strong enough to reverse? A drift of a few pips followed by three candles is not a fall.
- Is the third candle large compared with recent candles, or is it a small candle that barely closes into the first body?
If the answer to any is no, skipping the setup is a normal decision.
How to trade a morning star
There is no single correct method. This is a common outline for a long trade:
- Context. A decline into support.
- Pattern. All three candles have closed. Do not trade the third candle while it is still forming; it can turn into something else before the close.
- Entry. At the close of candle 3, or on a break above its high if you prefer more confirmation.
- Stop. Below the lowest low of the three candles, plus a buffer for the spread.
- Target. The next resistance level, or a multiple of the risk. See the risk-reward ratio.
For an evening star, reverse every step.
Worked example (illustrative figures)
On a 4-hour EUR/USD chart, price falls to a support zone near 1.0800. Candle 1 is bearish and closes at 1.0812. Candle 2 has a small body near 1.0805 and a low of 1.0788. Candle 3 is bullish and closes at 1.0846.
| Item | Level | Distance |
|---|---|---|
| Entry (close of candle 3) | 1.0846 | |
| Stop (below lowest low 1.0788, plus 2 pips) | 1.0786 | 60 pips |
| Target (next resistance) | 1.0966 | 120 pips |
| Reward to risk | 2 to 1 |
With a 2,000 USD account risking 1% (20 USD), a 60-pip stop allows about 0.33 USD per pip, which is a little over 0.03 lot on a standard EUR/USD contract. The lot size calculator does this sum for you, and position sizing explains the method. If the stop is wider than your risk limit allows, the trade does not fit your plan.
Notice the cost of waiting. Entry comes only after candle 3 closes, so a large third candle means a late entry price and a wide stop. That is one reason to pass on some textbook patterns.
Why these patterns fail
- No level. There was nothing for price to turn from.
- Trend strength. In a strong trend, a three-candle pause can be a rest before the move continues.
- Late entry. By the close of candle 3, much of the move may be done.
- News. A candle driven by a data release reflects the event. Check the economic calendar before trading any pattern.
- Hindsight. Finished charts show the stars that worked. The ones that failed are easy to forget. Test the pattern on a demo account and keep a log before risking money.
Related patterns
The engulfing candle is a two-candle reversal that traders often prefer because it needs only one extra candle. The morning star asks for more patience and gives a clearer stop, since the middle candle marks the turning area. A single-candle alternative is the pin bar.
Bottom line
The morning star and evening star are three-candle reversal clues: a strong move, a pause, then a strong move the other way. Use them where a support or resistance level already exists, wait for all three candles to close, and place the stop beyond the pattern’s extreme. Work out the lot size from that stop before you enter. Only risk money you can afford to lose. CFDs are complex, high-risk instruments.
Frequently asked questions
What is a morning star candlestick pattern?
A morning star is three candles at the end of a decline: a long bearish candle, a small-bodied candle that gaps or sits below it, and a long bullish candle that closes well into the first candle's body. Traders read it as a possible bullish reversal.
What is an evening star pattern?
It is the mirror image at the end of a rise: a long bullish candle, a small-bodied candle above it, then a long bearish candle that closes well into the first candle's body. It is read as a possible bearish reversal.
Do gaps matter in the forex market?
Forex trades nearly around the clock on weekdays, so true gaps are rare except over the weekend. Most traders accept a middle candle whose body sits below (or above) the first candle's body without a literal gap.
Is the middle candle always a doji?
No. The middle candle should have a small body, and it can be a doji or a small spinning top. A doji in the middle is often called a morning or evening doji star.
Where should the stop loss go on a morning star?
Usually just below the lowest low of the three candles, plus a buffer for the spread. A break of that low means the pattern has failed.
How reliable are morning and evening stars?
We have no verified statistic for their success rate, and figures quoted online vary. They work best at a clear support or resistance level, and they still fail often, so use a stop loss on every trade.