Ichimoku Cloud in Forex: The Five Lines and How to Read Them
Short answer: The Ichimoku cloud is a set of five lines built from the highest highs, lowest lows and closes of recent candles. With the usual 9, 26 and 52 settings, price above the cloud is read as an uptrend, below it as a downtrend, and inside it as no clear trend. It is a trend-reading tool. It does not predict where price will go.
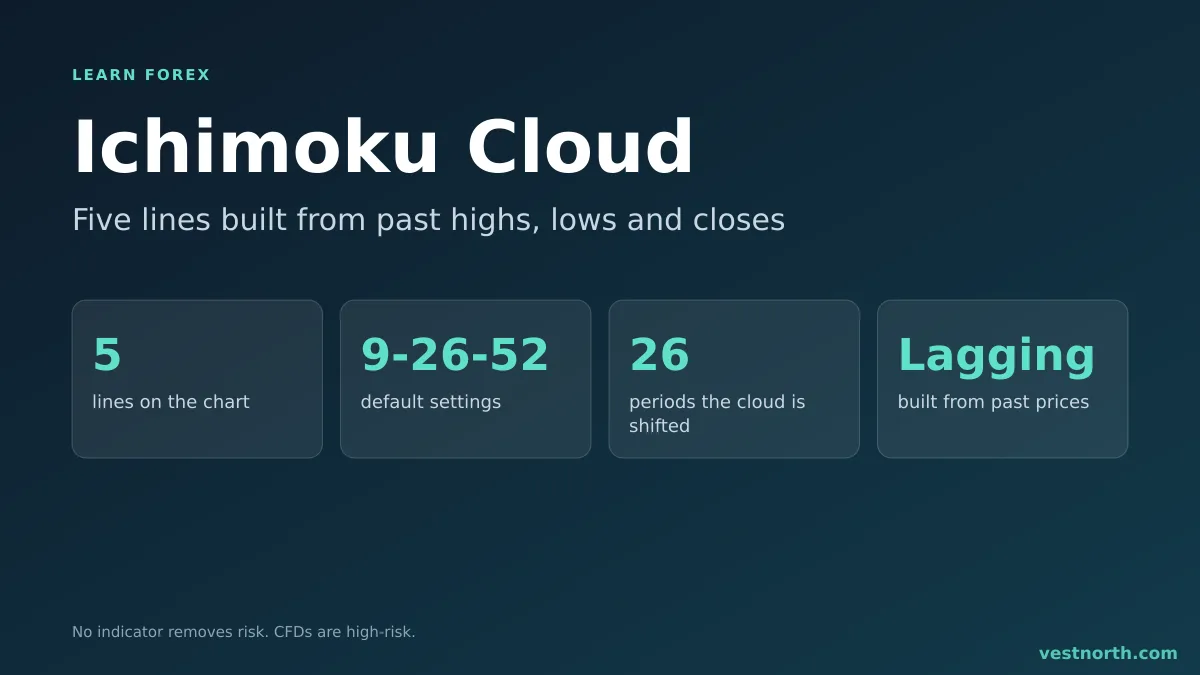
The Ichimoku setup in four numbers. Illustration, October 2026.
The five lines
Ichimoku Kinko Hyo comes from Japan. Most platforms, including MetaTrader 4 and 5, include it as a built-in indicator, so you do not need to install anything. The name is often translated as “one glance equilibrium chart”, because the cloud is meant to show trend direction at a glance.
| Line | Calculation (default) | Common reading |
|---|---|---|
| Tenkan-sen (conversion line) | Midpoint of the highest high and lowest low of the last 9 candles | Short-term momentum |
| Kijun-sen (base line) | Same midpoint over 26 candles | Medium-term balance point, often used as a trailing level |
| Senkou Span A | Average of Tenkan and Kijun, plotted 26 candles ahead | One edge of the cloud |
| Senkou Span B | Midpoint of the 52-candle high and low, plotted 26 candles ahead | The other edge of the cloud |
| Chikou Span (lagging span) | Current close, plotted 26 candles back | Compares today’s price with price 26 candles ago |
Notice that none of these is an average of closes in the way a moving average is. Tenkan, Kijun and Senkou B use the middle of a high-low range. That makes them react to the extremes in the window, not to every close.
If you want the averaging approach for comparison, read moving averages for beginners.
How to read the cloud
The cloud, called the kumo, is the shaded space between Senkou Span A and Senkou Span B.
- Price above the cloud: the trend is treated as up. The top of the cloud is a possible support area.
- Price below the cloud: the trend is treated as down. The bottom of the cloud is a possible resistance area.
- Price inside the cloud: no clear trend. Many traders stand aside.
- Span A above Span B: the cloud is usually drawn in one colour and read as bullish.
- Span B above Span A: the other colour, read as bearish.
- Thick cloud: the spans are far apart, so the cloud is a wider barrier. Thin cloud: price can cross it with less effort.
Because the cloud is plotted 26 candles ahead, you can see where the edges sit before price arrives. The numbers are still calculated from past data. The forward shift shows you a projection of old information, not a forecast.
Tenkan and Kijun crosses
When the Tenkan-sen crosses above the Kijun-sen, traders call it a bullish cross. A cross below is bearish. The same idea as a moving average crossover applies, and so does the same weakness: crosses are late and frequent in flat markets.
A common filter is location. A bullish cross with price above the cloud is read as stronger than one inside or below it. A bullish cross below the cloud is often ignored, because the larger trend is down.
The Chikou span
The Chikou span is today’s close drawn 26 candles back. Traders look at whether it sits above or below the price of that earlier candle. If the Chikou is above the candles behind it, current price is higher than it was 26 candles ago. That is a simple momentum check, and it also shows when the lagging line is about to run into old candles that could act as resistance.
A worked example
Assume a daily EUR/USD chart where price has been above the cloud for several weeks and Span A is above Span B. The Tenkan dips below the Kijun for two days, then crosses back above while price is still above the cloud. A trader following the trend might buy that second cross and place the stop below the Kijun-sen or below the cloud edge, whichever is closer to the idea being wrong.
Say entry is 1.0900 and the stop is at 1.0850, so the risk is 50 pips. On a 0.10 lot, one pip of EUR/USD is about $1, so the planned risk is about $50 before spread and slippage. If the account is $2,000, that is 2.5% of the balance, which is above the 1% to 2% many traders use as a ceiling. A 0.04 lot would put about $20 at risk, or 1%. The lot size calculator does this arithmetic for any stop distance.
The numbers are invented for the example. They show how the stop distance, not the indicator, sets the position size.
Where Ichimoku fails
- Ranges. Price moves in and out of a flat cloud and the Tenkan and Kijun cross back and forth. Each cross looks like a signal and most go nowhere. Our guide to range markets shows how to spot one first.
- Lag. By the time price clears the cloud, a large part of the move may be done. Entering late means a wider stop for the same idea.
- News spikes. A single candle can jump across the whole cloud around a data release. Check the economic calendar before you hold a position through an event.
- Clutter. Five lines plus candles can hide support and resistance levels you could draw yourself. Some traders use only the cloud and the Kijun.
- Fixed settings. 9, 26 and 52 are defaults, not laws. Changing the numbers is possible, but test any change on a demo account first.
Ichimoku with other tools
Ichimoku says what the trend looks like, not where to put the stop. Most traders pair it with a stop loss placed from structure, and with horizontal levels from support and resistance. Trend-following rules in general are covered in trend trading basics.
A demo does not reproduce real-market slippage, so live fills can differ from what you saw while practising.
Bottom line
Ichimoku condenses trend, momentum and possible support or resistance into one overlay, built from past highs, lows and closes. Use the cloud for direction, the Tenkan and Kijun for timing, and skip it when price is moving sideways. Size the trade from your stop distance and risk only money you can afford to lose. CFDs are complex, high-risk instruments, and no indicator removes that risk.
Frequently asked questions
What are the default Ichimoku settings?
The usual settings are 9, 26 and 52 periods. 9 drives the Tenkan-sen, 26 drives the Kijun-sen and the cloud shift, and 52 drives Senkou Span B.
What is the cloud in Ichimoku?
The cloud (kumo) is the shaded area between Senkou Span A and Senkou Span B, drawn 26 periods ahead of the current candle. Price above the cloud is read as an uptrend, price below it as a downtrend.
What does a thick cloud mean?
A thick cloud means the two spans are far apart. Many traders treat it as stronger support or resistance than a thin cloud, but price can still cut through it.
Is Ichimoku a leading or lagging indicator?
Mostly lagging. Four of its five lines are built from past prices. The cloud is plotted ahead, but it is calculated from data that already happened.
Does Ichimoku work in a ranging market?
It is weakest there. Price moves in and out of a flat cloud and the Tenkan and Kijun cross often, which produces many false signals.
Which timeframe suits Ichimoku?
The settings were designed around daily charts. Traders also use it on 4-hour and 1-hour charts, where signals come more often and more of them fail.