MACD Indicator in Forex: A Beginner's Guide
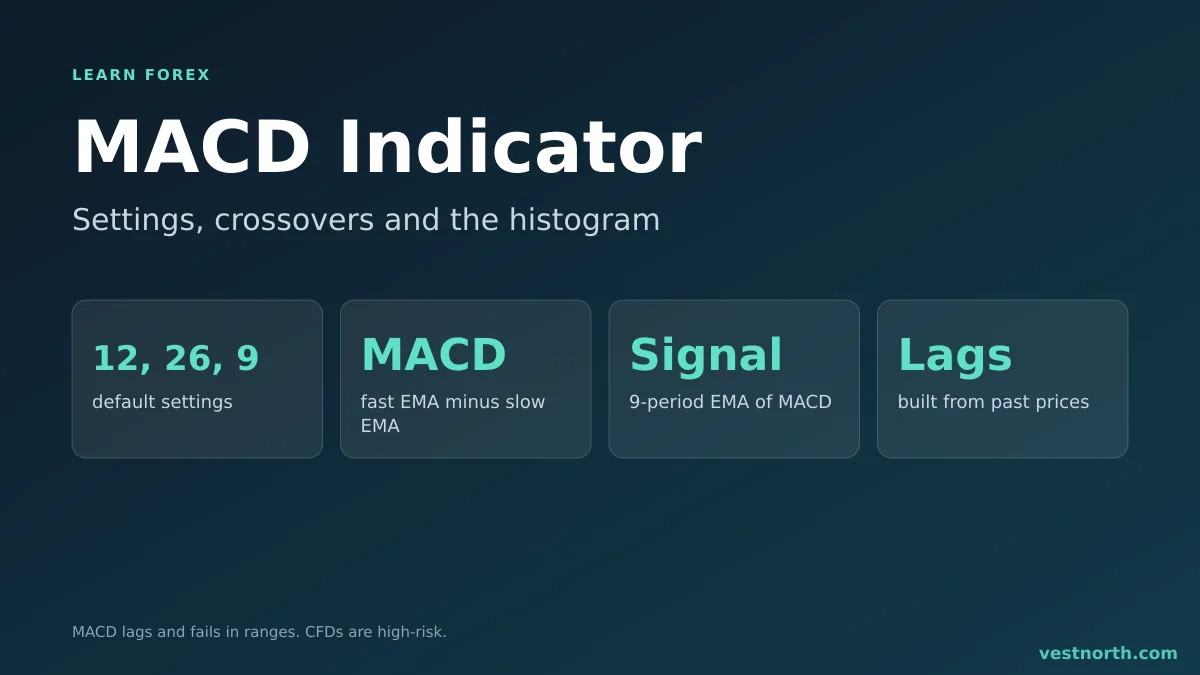
Short answer: MACD (Moving Average Convergence Divergence) subtracts a 26-period exponential moving average from a 12-period one and plots the result, with a 9-period signal line and a histogram. A cross of the MACD line over the signal line is read as a shift in momentum. It lags price and gives many false signals in sideways markets, so it is a confirmation tool, not a forecast.
The MACD line, signal line and histogram below a price chart. Illustration, October 2026.
What MACD is built from
MACD uses exponential moving averages (EMAs), which give more weight to recent prices than a simple average does. See moving averages for beginners for the difference.
There are three parts:
- MACD line: the 12-period EMA minus the 26-period EMA.
- Signal line: a 9-period EMA of the MACD line.
- Histogram: the MACD line minus the signal line, drawn as bars.
The line moves around a zero level. When the fast EMA is above the slow one, the MACD line is above zero, and the reverse when it is below. The standard setting is written (12, 26, 9). Your platform draws everything, and the numbers can be changed, though a different setting changes how quickly and how often signals appear.
How to read it
| Reading | What traders take from it |
|---|---|
| MACD line above zero | Fast average above slow, price has been rising |
| MACD line below zero | Fast average below slow, price has been falling |
| MACD crosses above signal | Momentum turning up |
| MACD crosses below signal | Momentum turning down |
| Histogram bars growing | Gap between the lines widening |
| Histogram bars shrinking | Momentum fading |
None of these says what price must do next. They describe what recent prices have already done.
Divergence
Divergence is when price makes a new high but the MACD line makes a lower high. Some traders read it as a sign that the move is weakening. It can stay in place for a long time before price turns, or never lead to a turn at all, so it is a reason to look closer rather than to trade at once.
A worked example
EUR/USD has been rising and the MACD line moves above the signal line while still near zero. A trader buys at 1.0850 with a stop at 1.0815, below the last swing low, a risk of 35 pips.
On a $6,000 account risking 1% ($60), the lot size is $60 ÷ (35 × $10) = about 0.17 lot. If the target is 70 pips away at 1.0920, the reward is twice the risk. The lot size calculator checks the sum and risk to reward explains the ratio.
If MACD crosses back down the next day while price is still above the stop, a rule such as “exit on a cross down” would close the trade early, possibly at a small profit or loss. That is a rule you set before the trade, not one to invent mid-trade. Fills in a fast market can also be worse than planned (slippage).
Pairing MACD with other tools
MACD measures momentum from price averages, so it works best next to something different:
- Trend. Trade crosses in the direction of the larger trend and skip the others.
- Levels. A cross right under a resistance level is weaker than one with room to run. See support and resistance.
- Overbought and oversold. The RSI indicator adds a separate reading, as does the stochastic oscillator, but all three come from price and often agree for the same reason.
Limits of MACD
- It lags. By the time the lines cross, part of the move has happened.
- In a range, it crosses back and forth and produces losing signals. See fakeout.
- It has no fixed scale. A MACD value on EUR/USD cannot be compared with one on USD/JPY.
- It ignores news. A data release can reverse price after a signal. Check the economic calendar.
- Short time frames are noisy, and the spread takes a larger share of small moves.
Common mistakes
- Trading every cross without a trend filter.
- Entering without a stop because “MACD will warn me”.
- Changing the settings after each loss until the past looks good, which says little about the future.
- Sizing the lot by feel instead of from the stop distance.
Practise on a demo account before using it live. Demo fills are cleaner than live ones.
Bottom line
MACD turns two moving averages into a momentum picture with a signal line and a histogram. It helps you see when a trend is speeding up or losing strength, and it lags and fails often when price moves sideways. Use it with the trend and a price level, set the stop where the idea fails and size the lot from that stop. CFDs are complex, high-risk instruments, so only trade money you can afford to lose.
Frequently asked questions
What does MACD stand for?
MACD stands for Moving Average Convergence Divergence. It shows the gap between a fast and a slow moving average, and how that gap is changing.
What are the default MACD settings?
Most platforms use 12, 26 and 9. That is a 12-period fast EMA, a 26-period slow EMA and a 9-period EMA of the MACD line, which is the signal line.
What is a MACD crossover?
A crossover happens when the MACD line crosses the signal line. A cross upward is read by some traders as rising momentum, and a cross downward as falling momentum. It lags and can fail in a sideways market.
What does the MACD histogram show?
The histogram bars show the distance between the MACD line and the signal line. Bars growing taller suggest the gap is widening, and bars shrinking suggest momentum is fading.
Is MACD a leading or lagging indicator?
It lags, because it is built from moving averages of past prices. It confirms what has already happened more than it predicts what comes next.
Does MACD work in a ranging market?
Poorly. In a sideways market the lines cross back and forth often, which gives many false signals. It tends to suit trending conditions better.