What Is the RSI Indicator in Forex?
Short answer: The RSI (Relative Strength Index) is a line between 0 and 100 that shows how strong recent price moves have been. The usual setting is 14 periods, with lines at 70 and 30. A reading above 70 or below 30 describes momentum, and it is not a buy or sell signal by itself, because price can stay there for a long time in a trend.
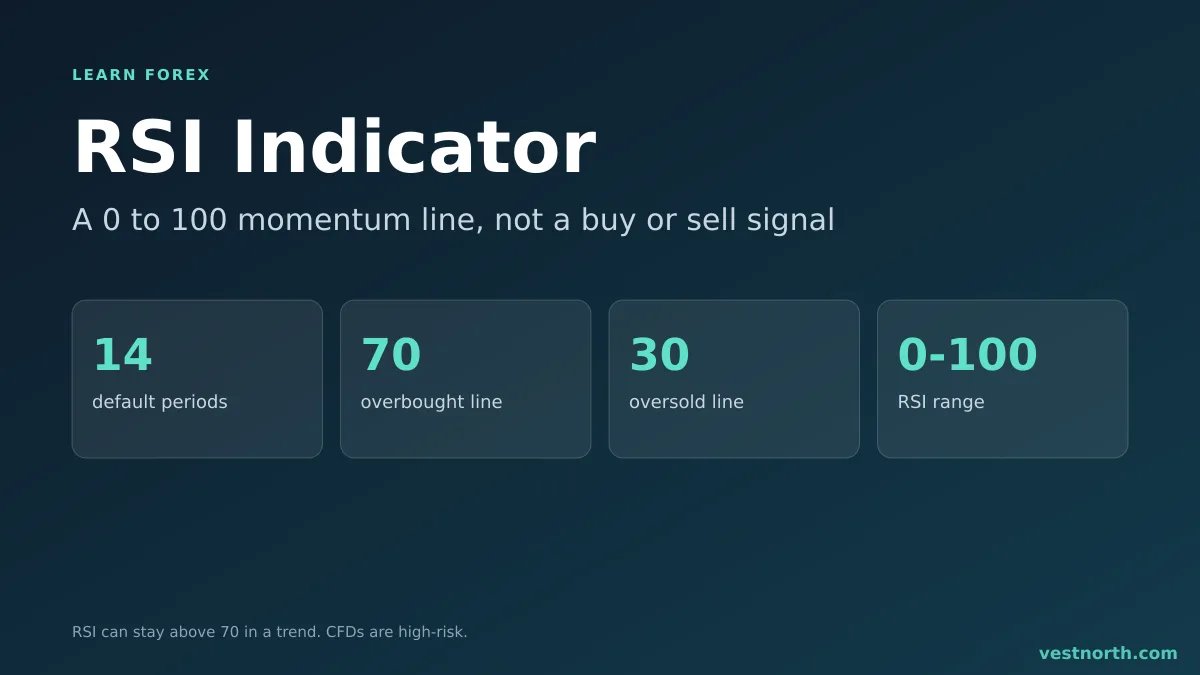
RSI with the 70 and 30 lines, and a stretch above 70 inside an uptrend. Illustration, October 2026.
What RSI measures
RSI compares the average size of recent up candles with the average size of recent down candles. If most of the movement was up, the line sits high. If most was down, it sits low. At 50, gains and losses over the period have been about equal.
The standard calculation uses closing prices over 14 candles. On a 1-hour chart that covers 14 hours. On a daily chart it covers 14 days. Your platform calculates it, so you do not need to do the sum by hand. The number tells you about speed, not direction of the next candle. For the basics of candles, see how to read a forex chart.
The 70 and 30 levels
| RSI reading | Common label | What it says |
|---|---|---|
| Above 70 | Overbought | Recent gains have been large compared with losses |
| 30 to 70 | Neutral | Mixed movement |
| Below 30 | Oversold | Recent losses have been large compared with gains |
“Overbought” does not mean the price is too high, and “oversold” does not mean it is too low. The labels only describe the recent pace. In a strong trend, RSI can spend weeks above 70 while price keeps rising. A trader who sold at the first reading above 70 would have been short for the whole move.
RSI in a range and in a trend
RSI is easiest to use when price moves sideways between a floor and a ceiling. A reading above 70 near resistance, or below 30 near support, lines up with a level that has held before. See support and resistance. Even then, a level can break, so a stop is needed (breakout and fakeout explain how).
In a trend, many traders shift their reading. In an uptrend they treat dips toward 40 to 50 as pullbacks, not 30. These ranges are habits some traders use, and they are not rules. Trend trading basics shows how to confirm the trend first.
Divergence
Divergence is when price and RSI disagree. Price makes a higher high, but RSI makes a lower high. Some traders read this as weakening momentum. The signal is often early: price can keep making new highs while the divergence grows. Treat it as a reason to look closer, not as an entry. The stochastic oscillator is a similar 0 to 100 momentum line built from the high-low range, and it shows the same weakness in strong trends.
A worked example
EUR/USD is in a range between 1.0800 and 1.0900. Price reaches 1.0895 and the 14-period RSI on the 1-hour chart reads 74. A trader who sells here might put the stop at 1.0925, above the range, and a target at 1.0820.
- Risk: 30 pips. Reward: 75 pips, a ratio of 2.5:1 before spread.
- On a $4,000 account risking 1%, the amount is $40. Lot size = $40 ÷ (30 × $10) = about 0.13 lot.
If price breaks above 1.0900 and RSI stays near 70, the range idea has failed. The stop at 1.0925 keeps the loss near $40, though fast markets can fill a stop worse than the price you set (slippage). The lot size calculator checks the sum, and risk to reward explains the ratio.
Limits of RSI
- It lags. It is built from past closes, so it reacts after price has moved.
- It gives many false readings in strong trends.
- Different settings give different pictures. A 7-period RSI reaches 70 and 30 more often than a 14-period RSI.
- It ignores news. A data release can send price through a level whatever RSI says. See the economic calendar.
Many traders combine RSI with moving averages or price levels. Adding indicators does not make a signal certain, and more indicators can mean more conflicting messages.
Common mistakes
- Selling only because RSI is above 70, with no stop.
- Using one setting on every pair and time frame without checking.
- Ignoring the trend and trading every overbought reading against it.
- Using RSI to place the stop instead of price.
Try the indicator on a demo account before using money. Demo fills do not include real slippage.
Related indicators: the Ichimoku cloud, trading with the VWAP and the MACD indicator.
Bottom line
RSI turns recent momentum into a number between 0 and 100. The 70 and 30 lines flag strong moves, not turning points. Use it as extra context next to a trend and a price level, put the stop where your idea is wrong, and size the lot from that distance. CFDs are complex, high-risk instruments, so only trade money you can afford to lose.
Frequently asked questions
What does RSI stand for in forex?
RSI stands for Relative Strength Index. It is a momentum indicator that compares recent average gains with recent average losses and shows the result as a number between 0 and 100.
What are the RSI 70 and 30 levels?
Many platforms draw lines at 70 and 30. A reading above 70 is often called overbought and below 30 oversold. These labels describe recent momentum only, and price can keep moving the same way after crossing them.
What is the default RSI setting?
The usual setting is 14 periods, which means 14 candles on whatever time frame the chart uses. Some traders use shorter or longer periods, but there is no setting that works on every pair.
Does RSI work in a strong trend?
It can stay above 70 for a long time in a strong uptrend, or below 30 in a strong downtrend. Selling every overbought reading in a trend is a common way to lose money.
What is RSI divergence?
Divergence is when price makes a new high or low but the RSI does not. For example, price makes a higher high while the RSI makes a lower high. Some traders read it as a sign of weakening momentum, and it is not a reliable signal on its own.
Can RSI tell me where to put a stop loss?
No. RSI measures momentum, not price levels. Place the stop where your trade idea is wrong, using support and resistance or a swing point, and size the lot from that distance.