Forex Pivot Points: How to Calculate and Use Them
Short answer: A pivot point is a level worked out from the previous session’s high, low and close: P = (High + Low + Close) ÷ 3. Support levels (S1, S2) and resistance levels (R1, R2) are then calculated from it. Traders watch these lines for pauses or turns in price. They are reference levels, not forecasts, and price can ignore them.
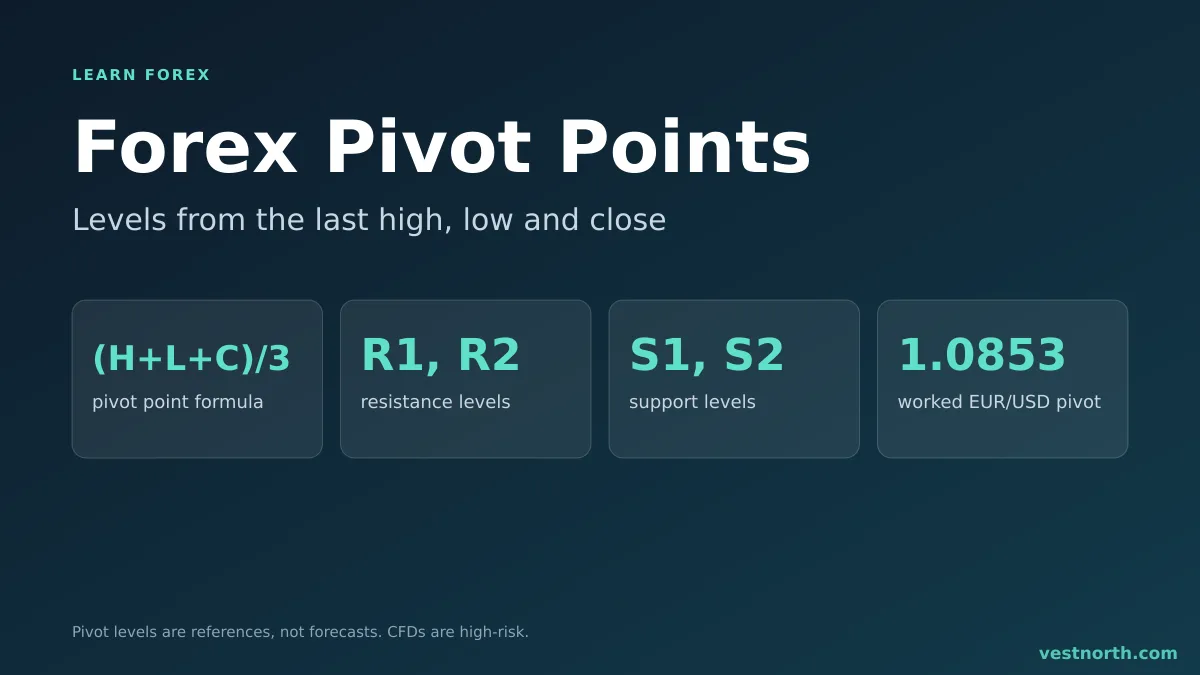
A daily pivot point with two support and two resistance levels. Illustration, October 2026.
How pivot points work
The idea is simple. The previous period’s range and close give a rough centre of where trading happened. The pivot is that centre. The other lines are spaced from it using the same high and low.
Because the numbers are fixed once the period ends, every trader using the same formula sees the same lines. That shared view is the main reason people watch them, since many orders can sit near the same level. It is not a guarantee that price reacts.
The classic formula
| Level | Formula |
|---|---|
| Pivot (P) | (High + Low + Close) ÷ 3 |
| Resistance 1 (R1) | (2 × P) - Low |
| Support 1 (S1) | (2 × P) - High |
| Resistance 2 (R2) | P + (High - Low) |
| Support 2 (S2) | P - (High - Low) |
Other versions exist, such as Fibonacci and Camarilla pivots, with different spacing. This guide covers the classic version. Charting platforms usually draw the lines for you, so check which version yours uses.
A worked example
Yesterday EUR/USD printed these figures: high 1.0900, low 1.0800, close 1.0860.
- P = (1.0900 + 1.0800 + 1.0860) ÷ 3 = 1.0853
- R1 = (2 × 1.08533) - 1.0800 = 1.0907
- S1 = (2 × 1.08533) - 1.0900 = 1.0807
- R2 = 1.08533 + 0.0100 = 1.0953
- S2 = 1.08533 - 0.0100 = 1.0753
Now say price falls early today and stalls near S1. A trader who likes this level buys at 1.0810 with a stop at 1.0780, a risk of 30 pips. The first target is the pivot at 1.0853, which is 43 pips away, a ratio of about 1.4 to 1. R1 at 1.0907 is 97 pips away, a ratio of about 3.2 to 1.
With a $4,000 account risking 1% ($40), the lot size is $40 ÷ (30 × $10) = about 0.13 lot. The lot size calculator checks the sum, and risk to reward explains the ratio. If price breaks through S1 and the stop is hit, the loss is close to $40, or more if the stop slips (slippage).
How traders use the levels
- Bounce. Price slows near a level and turns back. This works better in a quiet, sideways market.
- Break. Price closes beyond a level and keeps going. See breakout and fakeout.
- Bias. Price trading above the pivot is read by some traders as a mild upward lean for the day, and below as a downward lean.
- Targets. The next level can serve as a take profit. See take profit orders.
Pivot points sit alongside, not in place of, support and resistance drawn from price history. When a pivot line lands close to an old swing high or low, many traders give that area more weight.
Limits of pivot points
- The day boundary is not fixed. Forex trades 24 hours, so the high, low and close depend on where your platform cuts the day. Two charts can show different pivots for the same pair.
- They use only three prices. A wild day with one spike can distort the next day’s levels.
- They ignore the news. A data release can send price through several levels in seconds. Check the economic calendar.
- Spreads matter. The spread widens at rollover, so a trade near a level at that time costs more. See trading sessions.
- In a strong trend, price can run past several levels without a pause.
Common mistakes
- Buying every touch of a support line without a stop.
- Mixing pivot types without knowing which formula the chart uses.
- Using daily pivots to place a stop on a 5-minute trade and risking far more than planned.
- Forgetting to size the lot from the stop distance.
Bottom line
Pivot points give you a set of calculated levels for the day from yesterday’s high, low and close. Use them as reference points together with the trend and price history, put the stop where your idea is wrong and size the lot from that stop. Try them on a demo account first. CFDs are complex, high-risk instruments, so only trade money you can afford to lose.
Frequently asked questions
What is a pivot point in forex?
A pivot point is a price level calculated from the previous period's high, low and close. Traders also plot support and resistance levels from it and watch how price reacts near each line.
What is the pivot point formula?
The classic formula is P = (High + Low + Close) ÷ 3. Then R1 = 2P - Low, S1 = 2P - High, R2 = P + (High - Low) and S2 = P - (High - Low).
Which time frame do pivot points use?
Daily pivots use the previous day's high, low and close. Weekly and monthly pivots use those periods. Forex trades around the clock, so the day boundary depends on your platform or charting service.
Do pivot points predict where price will turn?
No. They are reference levels. Price can bounce, pause, cut through or ignore them. Many traders use them with a trend and a stop loss.
Are pivot points the same as support and resistance?
They produce support and resistance levels from a formula, while normal support and resistance is drawn from where price has turned before. The two often sit near each other, but they are not the same thing.
Can I trade pivot points on a demo account first?
Yes, and it is a sensible way to see how price reacts near the levels. Demo fills are cleaner than live fills, so expect real trading to differ.