Cup and Handle Pattern in Forex: How to Spot It, Trade It and Why It Fails
Short answer: A cup and handle is a continuation pattern on a price chart. Price falls in a rounded curve (the cup), climbs back to about the same high, then makes a small, shallow pullback (the handle). Traders look for a break above the handle’s high, with a stop below the handle low. It is a shape traders have learned to read, not a forecast, and many breakouts fail.
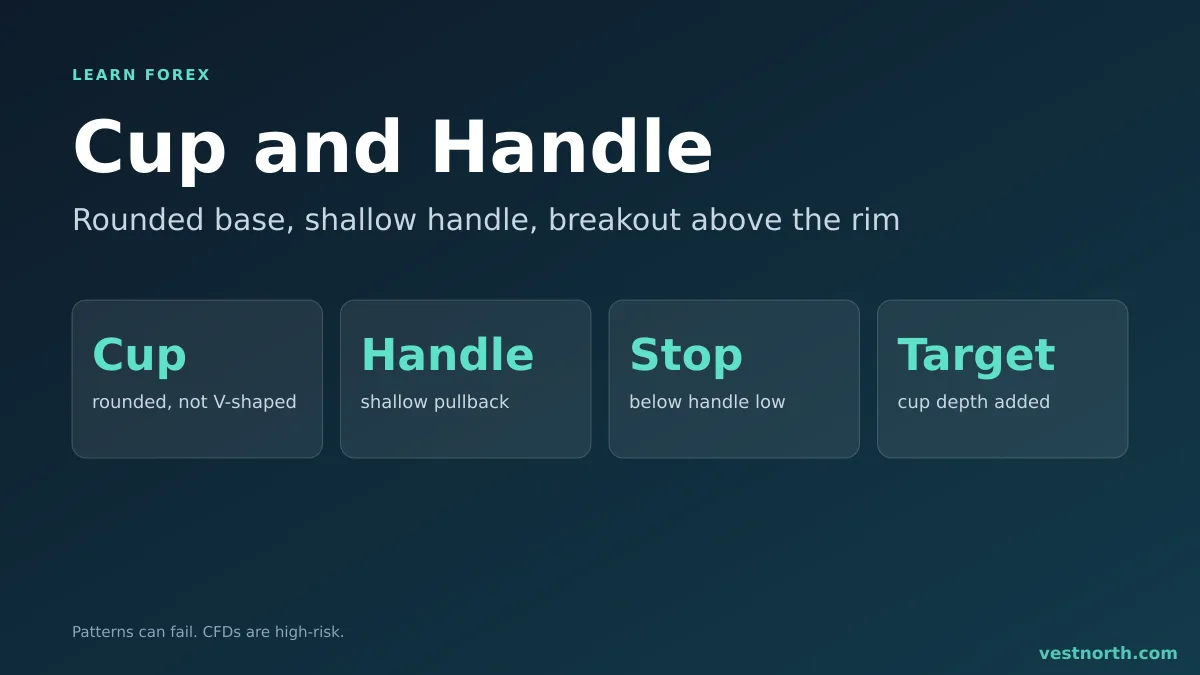
Cup and handle outline with the rim, handle and breakout level. Illustration, October 2026.
The two parts of the pattern
The cup. After an advance, price slips back, bottoms out and recovers to roughly where it started. The outline looks like a bowl or a letter U. A sharp V-shaped dip is usually rejected, because a rounded base suggests selling pressure faded slowly, not that price was jerked around by a single event.
The rim. The rim is the horizontal level at the top of the cup, where the earlier high sits. When price recovers to the rim, sellers who bought near that high often exit, so price stalls.
The handle. At the rim, price drifts down a small way. Traders generally want the handle to be shallow compared with the cup. A common rule of thumb is that it should retrace no more than about a third to a half of the cup’s depth. There is no official rule for this, so treat any such number as a personal filter.
The breakout. A close or move above the top of the handle (or the rim) is the trigger.
The shape resembles the rectangle pattern in that a level gets tested more than once, and it depends on the same idea as support and resistance.
Why traders read it as bullish
The story told about the pattern: sellers pushed price down, buyers slowly took control, and the small handle is a last shakeout of weak holders before price clears the old high. That story is a way to remember the shape. It is not evidence that the breakout will hold, and we have no verified statistic for how often the pattern works in forex.
It is most often discussed in stocks. Currency pairs trade around the clock and are driven by interest rates and news, so clean cups are less common and the same lesson applies: confirm with the broader trend.
A worked trade
Invented numbers for illustration. On a GBP/USD daily chart, price rises to 1.2800, then falls over three weeks to 1.2500 and climbs back to 1.2790. The cup is 300 pips deep. A handle forms: price dips to 1.2715 over four days, a pullback of about 75 pips, which is a quarter of the cup’s depth.
| Item | Level | Comment |
|---|---|---|
| Breakout entry (buy stop) | 1.2810 | 10 pips above the 1.2800 rim |
| Stop loss | 1.2705 | 10 pips below the handle low |
| Risk | 105 pips | 1.2810 minus 1.2705 |
| Target | 1.3110 | cup depth of 300 pips added to the 1.2810 entry |
| Reward to risk | about 2.9 to 1 | 300 divided by 105 |
On a 2,000 USD account risking 1% (20 USD), a 105-pip stop allows about 0.19 USD per pip. Pip values differ by pair and lot size, so use the lot size calculator for the real figure. The stop sets the position size, not the other way round: see position sizing.
A more cautious trader might wait for a daily close above 1.2800 before entering. That avoids some false breaks but enters at a worse price and gives a smaller reward to risk.
What makes a better or worse cup
- Rounded, not sharp. A V-shaped dip and recovery lacks the gradual build the pattern is named for.
- Handle in proportion. A handle as deep as half the cup is a warning that the move is not holding.
- Prior trend. Traders usually want an advance before the cup. A cup inside a downtrend is more likely to be a pause before lower prices.
- Volume is not available. Stock traders add volume to the picture. Spot forex has no central volume figure, and a broker’s tick volume only reflects that broker’s own feed. Do not lean on it.
- Timeframe. Daily and weekly cups carry more information than 5-minute ones, where spread and noise swamp the shape.
Why the pattern fails
- False breakout. Price pushes through the rim, triggers the order and falls back. This is the fakeout problem.
- Hindsight drawing. It is easy to find a cup on a finished chart and hard to find one that is still forming. Rules written before the move protect against fitting the shape afterwards.
- Scheduled news. A rate decision can cut through the handle in seconds. Check the economic calendar.
- Slippage. A buy stop fills at the next available price, which can be worse than the order level when the market is fast. See slippage.
- Overfitting the target. A measured move is a guess about where sellers appear. Price may stall at the old rim or at the next resistance zone well short of it.
For how this differs from a plain level break, read the guide to the breakout.
Bottom line
A cup and handle is a rounded recovery to a prior high followed by a small pullback, with a trade triggered above the handle. Write the entry, stop and size down before price moves, accept a share of false breaks and practise on a demo account first. Only risk money you can afford to lose. CFDs are complex, high-risk instruments.
Frequently asked questions
What is a cup and handle pattern in forex?
It is a chart pattern with two parts. The cup is a rounded fall and recovery back to the earlier high. The handle is a short, shallow pullback that follows. Traders watch for a break above the handle's high.
Is the cup and handle bullish or bearish?
The standard version is bullish and usually appears after an uptrend. An upside-down version, sometimes called an inverted cup and handle, is read as bearish.
How long does a cup and handle take to form?
There is no fixed length. On a daily chart the cup can take several weeks and the handle a few days to a couple of weeks. The same shape can appear on shorter timeframes but is less reliable there.
Where do traders put the stop loss on a cup and handle?
A common spot is just below the low of the handle. A more cautious stop sits below the midpoint of the cup, which is wider and needs a smaller position.
How do traders set a profit target on a cup and handle?
A common rule of thumb is to measure the depth of the cup and add it to the breakout level. It is a guide, not a promise, and price often stops short of it.
Why does the cup and handle fail?
The breakout can be a false break, the cup can be too V-shaped to show real balance, or news can move price through the pattern. Treat it as one input and size the trade for the stop.