Multiple Timeframe Analysis in Forex: How to Use Three Charts Without Confusion
Short answer: Multiple timeframe analysis means reading one pair on several chart periods. A common split is a higher chart for direction, a middle chart for the setup and a lower chart for the entry and stop, with each period roughly four to six times the one below. It keeps you from buying a small bounce inside a large downtrend.
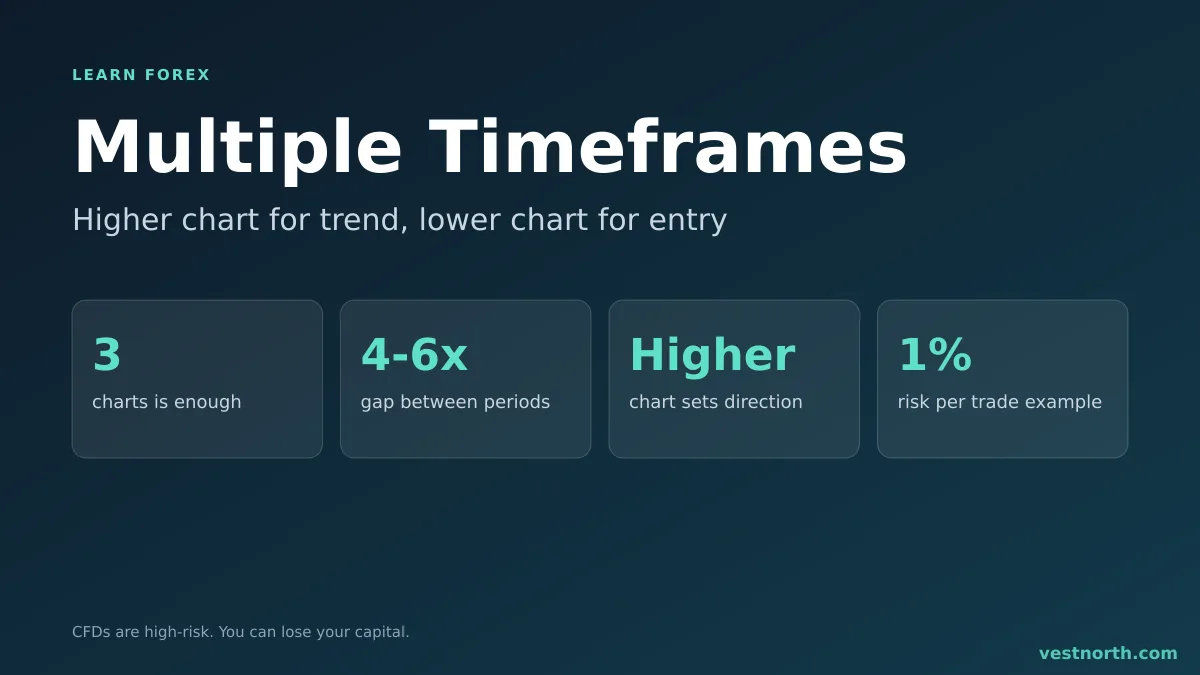
One pair, three charts, three jobs. Illustration, October 2026.
Why one chart is not enough
A chart shows only the slice of time you selected. On a 15-minute chart, EUR/USD can look like a clean rise. On the daily chart, that rise may be a small pullback inside a fall that has lasted months. A trade that looked good on the small chart then runs straight into the larger move.
Looking at more than one period fixes the context problem. It does not remove risk. It gives the entry a reason beyond the last few candles.
The three-chart method
Pick three timeframes with a gap between them. Charts that are too close, such as 1-hour and 2-hour, repeat the same information.
| Role | Question it answers | Swing set | Shorter-term set |
|---|---|---|---|
| Higher | Which way is the trend? | Weekly or daily | 4-hour |
| Middle | Where is the setup? | Daily or 4-hour | 1-hour |
| Lower | Where do I enter and place the stop? | 4-hour or 1-hour | 15-minute |
These sets are common conventions, not rules. Choose the set that matches how long you plan to hold a trade, and keep it the same for a while so you can judge results. Compare styles in scalping vs swing trading.
Step 1: direction on the higher chart
Decide whether the trend is up, down or sideways. Higher highs and higher lows indicate an uptrend; lower highs and lower lows indicate a downtrend. Market structure and a moving average are two common tools. If the higher chart is a range, many traders trade the edges or stay out.
Step 2: the setup on the middle chart
Look for a pullback to a level that matters: a support or resistance zone, a moving average or a retracement area. The trade idea is to join the higher-chart trend after a pause.
Step 3: the entry on the lower chart
Wait for a trigger at that level, such as a reversal candle or a small break of structure. Place the stop beyond the swing that would invalidate the idea, then size the position from that distance using the lot size calculator.
A worked example
Assume a swing trader uses daily, 4-hour and 1-hour.
- Daily: GBP/USD has made higher highs and higher lows for several weeks. Bias is long only.
- 4-hour: Price has pulled back to a zone where a previous high acted as resistance and may now act as support.
- 1-hour: A bullish engulfing candle forms in the zone. Entry is above its high.
- Risk: The stop goes below the 4-hour swing low. If that is 70 pips away and the account risks 1% of 2,000 USD (20 USD), the position is about 0.29 USD per pip. See position sizing.
The numbers are illustrative. If the lower-chart signal had appeared while the daily chart was falling, the plan would be to skip it.
When timeframes disagree
Conflicts are normal. Common ways to handle them:
- Follow the higher chart. Trade only in its direction.
- Wait. If the middle chart is mid-move and the lower chart is unclear, no setup is a valid result.
- Shrink the target. A trade against the higher trend is more likely to stall at the first obstacle, so some traders take profit sooner. That is a choice, not a proven edge.
Common mistakes
- Too many charts. Five timeframes produce five opinions. Stay with three.
- Switching until one agrees. Hunting through periods for a chart that supports the trade you already want is confirmation bias.
- Stop from the lower chart, target from the higher. This can give a pretty reward-to-risk ratio on paper that rarely plays out. Check the risk-reward ratio against how often price actually reaches the target.
- Ignoring news. A data release can break all three charts at once. Check the economic calendar.
- Changing the plan mid-trade. Opening a smaller chart after entry and getting scared by a normal pullback is common. Decide the exit rules before you enter.
Bottom line
Use a higher chart for trend, a middle chart for the setup and a lower chart for entry and stop, with about four to six times between them. Trade with the higher trend or stay out, keep to three charts, and size the position from the stop distance. Test the method on a demo account and record results in a journal before you risk real money. Only trade money you can afford to lose. CFDs are complex, high-risk instruments.
Frequently asked questions
What is multiple timeframe analysis in forex?
It means looking at the same pair on more than one chart period, for example daily, 4-hour and 1-hour, so the direction, the setup and the entry each come from a different chart.
Which timeframes should a beginner use?
Pick three that are roughly four to six times apart. Common sets are weekly, daily and 4-hour for swing trading, or 4-hour, 1-hour and 15-minute for shorter trades.
What if two timeframes disagree?
The higher timeframe usually carries more weight, so many traders only take trades in its direction or stay out. A lower-chart signal against the higher trend is a lower-quality setup.
Can I use too many timeframes?
Yes. More than three charts often produces conflicting signals and hesitation. Three is enough for most methods.
Does multiple timeframe analysis improve win rate?
We have no verified statistic. It can improve context and the quality of stop placement, but it does not guarantee winning trades.
Should my stop loss use the lower or higher timeframe?
It depends on the setup. A stop placed beyond a higher-timeframe swing is harder to hit by noise but is wider, so position size must be smaller to keep risk the same.