Forex Win Rate vs Risk-Reward: The Break-Even Table and Why Win Rate Alone Misleads
Short answer: Win rate is the share of trades that win, but it only means something next to risk-reward, the average win divided by the average loss. The break-even win rate = 1 ÷ (1 + R) before costs: 50% at 1:1, about 33.3% at 1:2 and 25% at 1:3. A 70% win rate can still lose money if wins are small. This page is arithmetic and does not promise profits from any ratio.
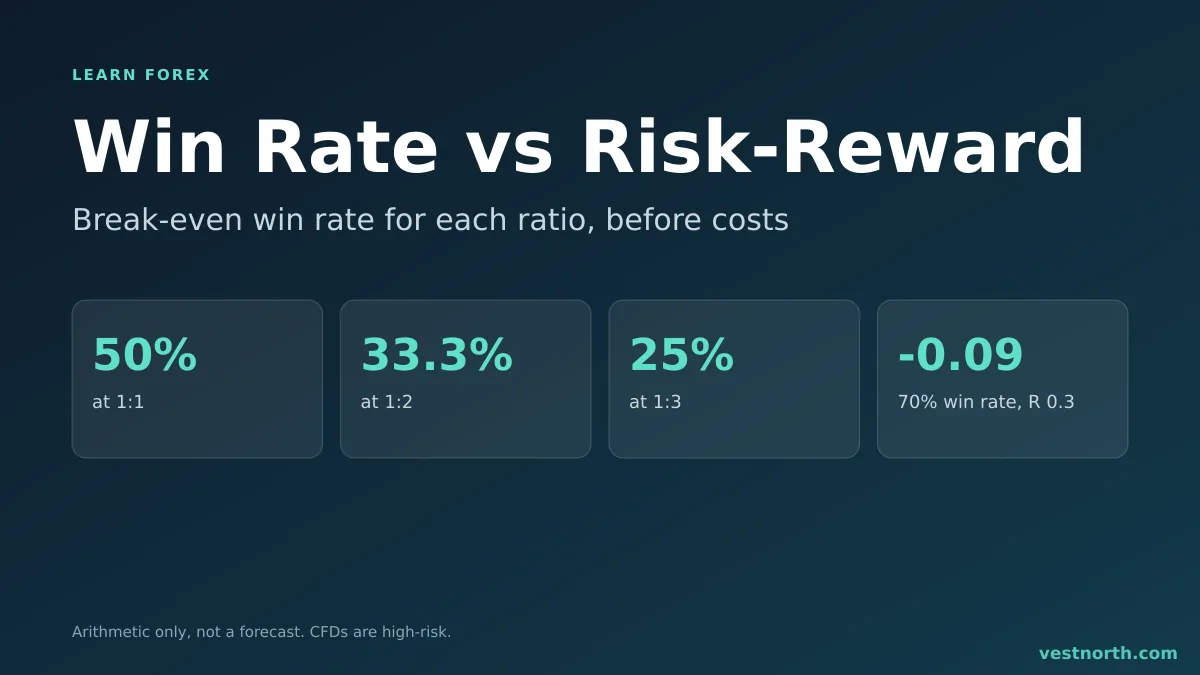
Break-even win rate by risk-reward ratio. Illustration, November 2026.
What the two numbers mean
- Win rate: winning trades ÷ all closed trades.
- Risk-reward ratio (R): average win ÷ average loss. If you risk $100 and make $200 when right, R = 2, often written 1:2. See the risk-reward ratio page for how to set it on a trade.
Neither number is enough alone. A trader who wins 9 of 10 trades but gives back a large loss on the tenth can be behind. A trader who wins 3 of 10 with large winners can be ahead.
The break-even formula
Over many trades the result is zero when:
win rate × R = (1 − win rate) × 1
Solving for the win rate gives:
Break-even win rate = 1 ÷ (1 + R)
| Risk-reward (R) | Break-even win rate |
|---|---|
| 0.5 (1:0.5) | 66.7% |
| 1 (1:1) | 50% |
| 1.5 (1:1.5) | 40% |
| 2 (1:2) | 33.3% |
| 3 (1:3) | 25% |
| 4 (1:4) | 20% |
Above the line the strategy gains on average, below it the strategy loses, and exactly on it the strategy earns nothing. This is before spreads, commissions and swaps.
Expectancy: the number that combines both
Expectancy per trade = (win rate × R) − (1 − win rate), in units of the amount risked. It is covered in full on the trade expectancy page. Here are four examples:
| Win rate | R | Calculation | Expectancy |
|---|---|---|---|
| 40% | 2 | 0.4 × 2 − 0.6 | +0.20 |
| 60% | 0.5 | 0.6 × 0.5 − 0.4 | −0.10 |
| 70% | 0.3 | 0.7 × 0.3 − 0.3 | −0.09 |
| 30% | 3 | 0.3 × 3 − 0.7 | +0.20 |
Over 100 trades risking $100 each, 40% at R = 2 gives 40 × $200 − 60 × $100 = +$2,000. A 60% win rate at R = 0.5 gives 60 × $50 − 40 × $100 = −$1,000, even though six trades in ten win.
These are arithmetic examples. Real trades vary in size, and no ratio guarantees a profit.
Why a high win rate can still lose
Strategies that take small profits quickly and hold losers have high win rates and small average wins. One bad trade can erase many small ones. The mix often comes from moving a stop loss further away to avoid taking a loss, or closing winners early out of fear. See trading psychology.
Why a low win rate can be fine
Strategies that wait for larger moves, such as trend trading, often win less than half the time and rely on winners that are two or three times the loss. The cost is a long run of small losses between wins. At a 40% win rate, the chance that a particular set of 5 trades are all losses is 0.6⁵ = 7.8% and for 8 trades it is 0.6⁸ = 1.7%. Over hundreds of trades such runs will happen. They are normal, and they show up in drawdown.
Costs move the line
Spreads and commissions are paid on every trade. Say the cost is 0.1 of the amount risked per trade. With R = 2 and a 40% win rate, expectancy falls from +0.20 to +0.10. At a 35% win rate, the same R gives 0.35 × 2 − 0.65 = +0.05 before costs, and −0.05 after. So the real break-even win rate is higher than the table when costs are significant. Short-term strategies with small targets feel this most. See forex trading costs and spread vs commission.
How much data do you need?
A win rate measured on a few trades is a weak estimate. If the true rate is 40%, the standard error with 20 trades is √(0.4 × 0.6 ÷ 20) ≈ 11 points. A reading of 30% or 50% would not be surprising. With 100 trades the standard error is about 4.9 points. Keep a trading journal and record the result in R (each trade’s profit divided by the amount risked), so that winners and losers of different sizes can be compared on one scale.
Using this in a trading plan
- Measure your average win and average loss from real or demo records, not from hopes.
- Compute R and the break-even win rate from the formula above.
- Compare it with your measured win rate and add a margin for costs.
- Size positions so that a normal losing run stays shallow: see risk per trade and position sizing.
- Write the rules in your trading plan and review them over a large sample.
Try ideas on a demo account before using real money, remembering that demo fills can differ from live ones.
Common mistakes
- Chasing a high win rate. It can come from tiny targets and wide stops.
- Setting 1:3 targets that rarely hit. A ratio only helps if the price reaches the target often enough.
- Judging a system on 10 or 20 trades. The sample is too small.
- Forgetting costs. Break-even tables are before spreads and commissions.
- Changing the ratio mid-trade. Moving a stop or target after entry makes the record meaningless.
Bottom line
Win rate and risk-reward only make sense together: break-even is 50% at 1:1, 33.3% at 1:2 and 25% at 1:3 before costs. A 40% win rate with R = 2 gives +0.20 per trade in the example above, and a 70% win rate with R = 0.3 gives −0.09. Measure both numbers from many trades, include costs, and size positions to survive a losing run. Only trade with money you can afford to lose. Read more on risk management.
Frequently asked questions
What is win rate in forex?
It is the percentage of closed trades that make a profit. 40 winning trades out of 100 is a 40% win rate.
What win rate do I need to break even?
Break-even win rate = 1 ÷ (1 + R), where R is average win divided by average loss. At 1:1 you need 50%, at 1:2 about 33.3% and at 1:3 25%, before costs.
Is a 70% win rate good?
Not by itself. If the average win is 0.3 times the average loss, a 70% win rate loses money: 0.7 × 0.3 − 0.3 = −0.09 per trade, in units of the amount risked.
Can I be profitable with a win rate below 50%?
Yes, if wins are large enough compared with losses. With a 1:2 ratio, a 40% win rate gives +0.2 per trade before costs. The result depends on the numbers, and nothing here guarantees a profit.
How many trades do I need to trust my win rate?
Many more than a few dozen. With 20 trades at a true 40% win rate, one standard error is about 11 percentage points, so the measured figure could easily read 30% or 50%.
Do spreads and commissions change the break-even win rate?
Yes. Costs make each loss slightly larger and each win slightly smaller, so you need a higher win rate than the table shows.