Forex Trade Expectancy Explained: The Formula, Worked Examples and Limits
Short answer: Expectancy is the average result per trade over many trades: (win rate × average win) − (loss rate × average loss). With a 40% win rate, a $150 average win and a $100 average loss, expectancy is exactly $0. Raise the average win to $200 and it becomes +$20 per trade. It describes past results only, and says nothing certain about the next trade.
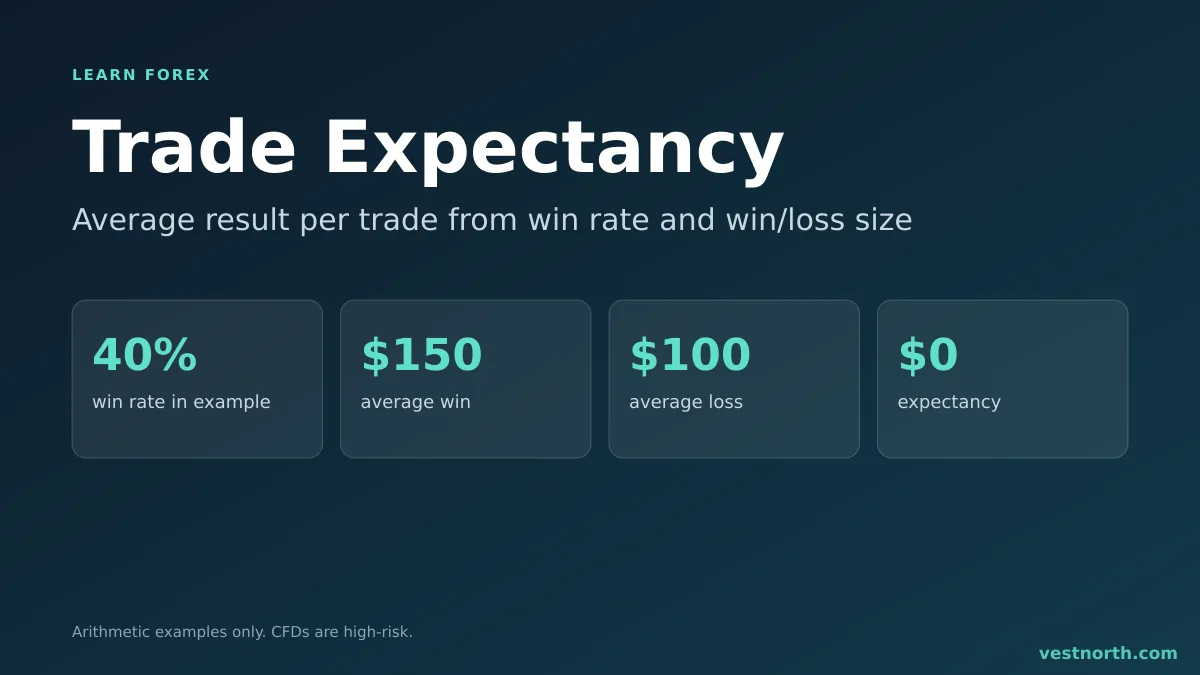
The expectancy formula with one example. Illustration, November 2026.
The formula
Expectancy = (W × A) − (L × B)
- W = win rate (wins ÷ total trades)
- A = average winning trade
- L = loss rate (1 − W)
- B = average losing trade, as a positive number
Include every cost in A and B: spread, commission and swap. A strategy that looks positive before costs can be negative after them.
Worked examples
| Strategy | Win rate | Avg win | Avg loss | Calculation | Expectancy |
|---|---|---|---|---|---|
| A | 60% | $100 | $100 | 0.6×100 − 0.4×100 | +$20 |
| B | 40% | $150 | $100 | 0.4×150 − 0.6×100 | $0 |
| C | 35% | $250 | $100 | 0.35×250 − 0.65×100 | +$22.50 |
| D | 70% | $50 | $150 | 0.7×50 − 0.3×150 | −$10 |
Strategy D wins seven trades in ten and still loses money, because each loss wipes out three wins. Strategy C loses almost two trades in three and makes money. A win rate on its own tells you very little. Expectancy combines it with the size of wins and losses, which is why the risk-reward ratio matters as much as accuracy.
Break-even win rate
For a fixed reward-to-risk ratio R (average win ÷ average loss), the break-even win rate is 1 ÷ (1 + R).
| Reward-to-risk | Break-even win rate |
|---|---|
| 0.5 : 1 | 66.7% |
| 1 : 1 | 50% |
| 1.5 : 1 | 40% |
| 2 : 1 | 33.3% |
| 3 : 1 | 25% |
Above that win rate the strategy averages a gain, below it a loss. Costs push the real break-even a little higher, particularly with small stops.
Expectancy in R multiples
Instead of dollars, count each result in units of initial risk. If you risk $100 and a trade wins $250, that is +2.5R. A stop-out is −1R. Expectancy in R then reads the same for any account size:
Strategy C above, in R: 0.35 × 2.5R − 0.65 × 1R = +0.225R per trade.
This makes results comparable between a $500 account and a $50,000 account, and it fits naturally with sizing by a fixed percentage of the account. See risk per trade.
What it means over a series of trades
Take strategy C at $100 risk per trade, with $22.50 expectancy. Over 100 trades the average outcome is about +$2,250. The word “average” carries a lot of weight. Individual runs vary widely. With a 35% win rate, a run of 8 or more losing trades in a row is not unusual across a few hundred trades: the chance of 8 straight losses starting at any given trade is 0.65 to the power of 8, about 3%. You would see a drawdown of roughly 8R during that run, which on 1% risk per trade is about 8% of the account. Read forex drawdown explained for how to measure and limit that.
How to calculate it from your own trades
- Export or write down every closed trade from your trading journal, with net result after costs.
- Count wins and losses. Win rate = wins ÷ total.
- Average the winning trades and average the losing trades separately.
- Apply the formula. Or just average all net results, which gives the same number.
Check for the second method: if you had 20 trades with a total net result of +$300, expectancy is $300 ÷ 20 = $15 per trade.
Limits of the number
- Small samples. With 15 or 20 trades, one big win changes the figure. Treat it as a rough estimate until the sample is larger.
- Changing conditions. A trend-following rule may do well while markets trend and poorly in a range. A figure from one period is not a promise.
- Averages hide fat tails. A few large losses or wins can dominate. Look at the biggest loss as well as the average.
- Costs and slippage. Fast markets fill worse than planned. See slippage and trading costs.
- Curve fitting. Adjust a rule until the past looks perfect and the expectancy is probably an illusion.
- Behaviour. Skipping losers or moving stops changes the real record away from the plan.
We have not tested any strategy for this page, and every figure above is arithmetic, not a result anyone achieved.
Using expectancy in practice
Expectancy helps with questions like these:
- Is a 1.5:1 setup worth taking if it wins only 38% of the time? At 1.5:1 the break-even rate is 40%, so 38% averages a small loss.
- Does a wider target help or hurt? Widening the target may raise the average win but lower the win rate. Recalculate with both numbers.
- Is a rule worth keeping? If 60 logged trades under a rule show a negative expectancy after costs, change or drop the rule, and test the change on a demo account first.
Pair it with position sizing so that a bad run does not end the account. See position sizing and risk management.
Bottom line
Expectancy is average win rate times average win minus loss rate times average loss, with costs included. A low win rate can work with a large reward-to-risk ratio, and a high win rate can still lose money. Calculate it from your own logged trades, keep a large enough sample, and remember it describes the past. Leveraged trading carries a high risk of loss, so only use money you can afford to lose.
Frequently asked questions
What is expectancy in forex trading?
Expectancy is the average profit or loss per trade, calculated from your win rate, average win and average loss. A positive number means the past results averaged a gain per trade, before any guarantee about the future.
What is the expectancy formula?
Expectancy = (win rate x average win) - (loss rate x average loss). With a 40% win rate, a $150 average win and a $100 average loss: (0.4 x 150) - (0.6 x 100) = 0.
Can a strategy with a low win rate have positive expectancy?
Yes. If the average win is large enough compared with the average loss, a win rate below 50% can still average a gain. A 35% win rate with a 2.5:1 reward-to-risk ratio gives a positive result.
What is expectancy in R multiples?
It is expectancy measured in units of initial risk. If you risk $100 per trade and the expectancy is $20, that is 0.2R per trade.
How many trades are needed for expectancy to mean anything?
More trades give a steadier estimate. A figure from 20 trades can change a lot with a few more results, so many traders want a larger sample, and they still treat it as an estimate.
Does positive expectancy mean I will make money?
No. It describes past trades. Markets change, costs reduce results, and losing streaks can be long, so positive expectancy is not a guarantee of future profit.