Momentum Trading in Forex: How It Works, Which Tools Measure It and Where It Fails
Short answer: Momentum trading means entering in the direction of a fast price move and leaving when the speed fades. Momentum is the rate of change of price, so a pair rising 80 pips in two hours has more momentum than one rising 80 pips in two weeks. Traders measure it with indicators such as the RSI and MACD, or just by reading the size of recent candles. The main risk is entering late, just before the move runs out.
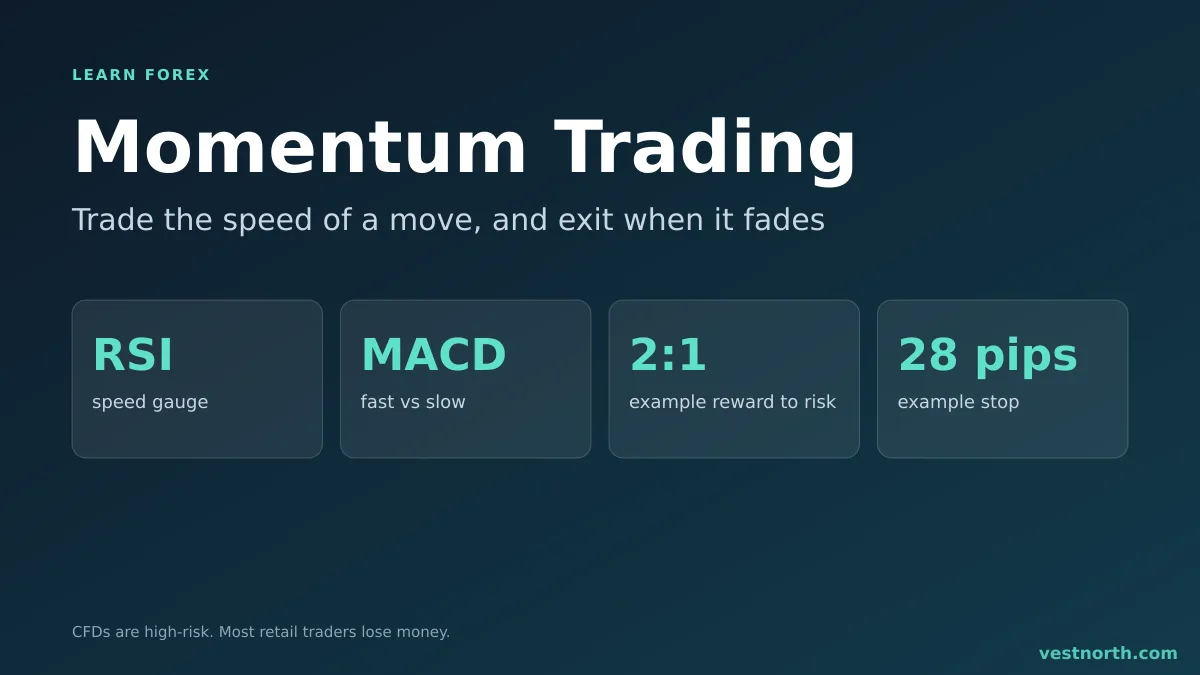
Momentum idea: speed of the move, confirmation and exit. Illustration, November 2026.
Momentum versus trend
A trend is direction. Momentum is speed. The two are related but they are not the same thing.
Picture EUR/USD in a steady uptrend. Over three weeks it climbs 150 pips, a little each day. Momentum is modest. Then a data release pushes it 70 pips in one hour. Momentum is now high, even though the trend direction has not changed. Momentum traders focus on those bursts. Our page on trend trading covers the slower side of the same idea.
Momentum also fades before a trend ends. When each new high comes with smaller candles, the trend is still up but the speed is dropping. That is often the first hint that a pullback is near.
How momentum is measured
You do not need an indicator to see momentum. Large candle bodies with small wicks, closing near their highs (or lows), show it directly. Indicators put a number on the same thing.
| Tool | What it compares | Typical reading |
|---|---|---|
| RSI (14) | Average gains with average losses over 14 candles | Above 50 favours buyers, below 50 favours sellers |
| MACD (12, 26, 9) | A fast and a slow moving average | Histogram growing means speed is rising |
| Rate of change (ROC) | Current close with the close N candles ago | Positive and rising means upward speed |
| Stochastic (14, 3, 3) | Close relative to the recent high-low range | Stays near the top in strong rises |
The settings in brackets are the common defaults; they are conventions, not rules. The stochastic oscillator and the RSI are often read differently in momentum trading than in range trading. In a strong trend, an RSI above 70 is not an automatic sell signal. It can stay there for many candles, which is exactly what a momentum trader wants to see.
Three ways traders use it
1. Breakout with speed
Price leaves a range or crosses a key level on large candles, and the momentum indicator rises at the same time. The trader enters on the break or on a quick retest. This overlaps with breakout trading, and the same fakeout risk applies.
2. Momentum continuation
During a trend, the trader waits for a pullback, then enters when the indicator turns back in the trend direction. For example, in an uptrend the RSI dips toward 40 to 50 and then crosses back up.
3. Divergence as an exit signal
If price prints a higher high but the RSI prints a lower high, speed is fading. Momentum traders often use this to tighten stops or take profit, not to open a new trade against the move.
Worked example (illustrative figures)
GBP/USD has been quiet near 1.2650. A 15-minute candle breaks above 1.2665 with a 22-pip body, and the RSI jumps from 52 to 64.
| Item | Level | Distance |
|---|---|---|
| Entry (after the candle closes) | 1.2668 | |
| Stop (below the breakout candle low) | 1.2640 | 28 pips |
| First target (twice the risk) | 1.2724 | 56 pips |
| Reward to risk | 2 to 1 |
Risking 1% of a 5,000 USD account (50 USD) over 28 pips is about 1.79 USD per pip. With 10 USD per pip per standard lot, that is roughly 0.18 lot. The lot size calculator does this sum for any pair. These prices are invented for the example and are not a signal.
Now the failure case. If price falls back below 1.2640, the trade loses 28 pips plus any slippage. Three such losses in a row cost about 3% of the account. Momentum entries fail often enough that the sizing matters more than the setup.
Where momentum trading goes wrong
- Late entries. By the time the indicator confirms, much of the move may be done. The stop then has to be wide, or the reward to risk shrinks.
- Range markets. In a sideways market, fast moves usually reverse. Check the range market page before applying momentum rules.
- News spikes. A single release can create a burst that reverses within minutes. Spreads can also widen, and fills can differ from the price you saw. See slippage.
- Over-reading indicators. RSI, MACD and stochastic all use the same price data. Three of them agreeing is not three independent confirmations.
- Chasing after a loss. A missed move is not owed back. Rules written in a trading plan help here.
A simple checklist
- Is the market trending, or is it in a range?
- Are recent candles larger than the previous 10 to 20?
- Does the momentum indicator agree with price, with no divergence?
- Is there a nearby level, such as a prior high, that could stop the move?
- Where is the stop, and is the position sized so the loss is within your limit?
- Is a major news release due? Check the economic calendar.
If you cannot answer the fifth question before entering, skip the trade.
Bottom line
Momentum trading follows the speed of a move and tries to leave as that speed fades. RSI, MACD and candle size are the usual gauges, and a pair can keep a high reading for a long time in a strong trend. The method struggles in ranges and around news, and late entries make losses larger. Size every trade from the stop distance, and practise on a demo account first. Only risk money you can afford to lose. CFDs are complex, high-risk instruments.
Frequently asked questions
What is momentum trading in forex?
Momentum trading means entering in the direction of a fast, sustained price move and exiting when the speed fades. The trader bets that a pair that has moved strongly will keep moving for a while longer.
Which indicators measure momentum?
Common ones are the RSI, the MACD, the stochastic oscillator and rate of change (ROC). Each compares recent price changes with earlier ones. Many traders also read momentum directly from the size of recent candles.
Is momentum the same as trend?
No. A trend is the overall direction. Momentum is the speed of the move. A pair can be in an uptrend while momentum is slowing, which often shows up before a pullback.
Does momentum trading work in a range market?
Usually poorly. In a sideways market, strong candles tend to reverse at the edges of the range, so momentum signals produce many false starts. Many traders check for a trending market first.
What is momentum divergence?
Divergence happens when price makes a new high or low but the momentum indicator does not. It suggests the move is losing speed. It is a warning, not a timed reversal signal.
How do I set a stop loss on a momentum trade?
A common approach is to place the stop beyond the last swing point or beyond a multiple of the average true range, then size the position from that distance so the loss stays within your chosen risk.
Is momentum trading suitable for beginners?
The idea is simple, but entries are often made after a big move has already started, which makes stops wide and losses larger when it fails. Practise on a demo account first.