The Donchian Channel in Forex: How the Indicator Is Built and How Traders Use It
Short answer: The Donchian channel draws a band around price using only highs and lows. The upper line is the highest high of the last N candles, the lower line is the lowest low, and the middle line is the average of the two. A common setting is 20 periods. Traders treat a close above the upper line as a breakout to the upside, and a close below the lower line as a breakout to the downside. The indicator is simple, but breakouts fail often in sideways markets.
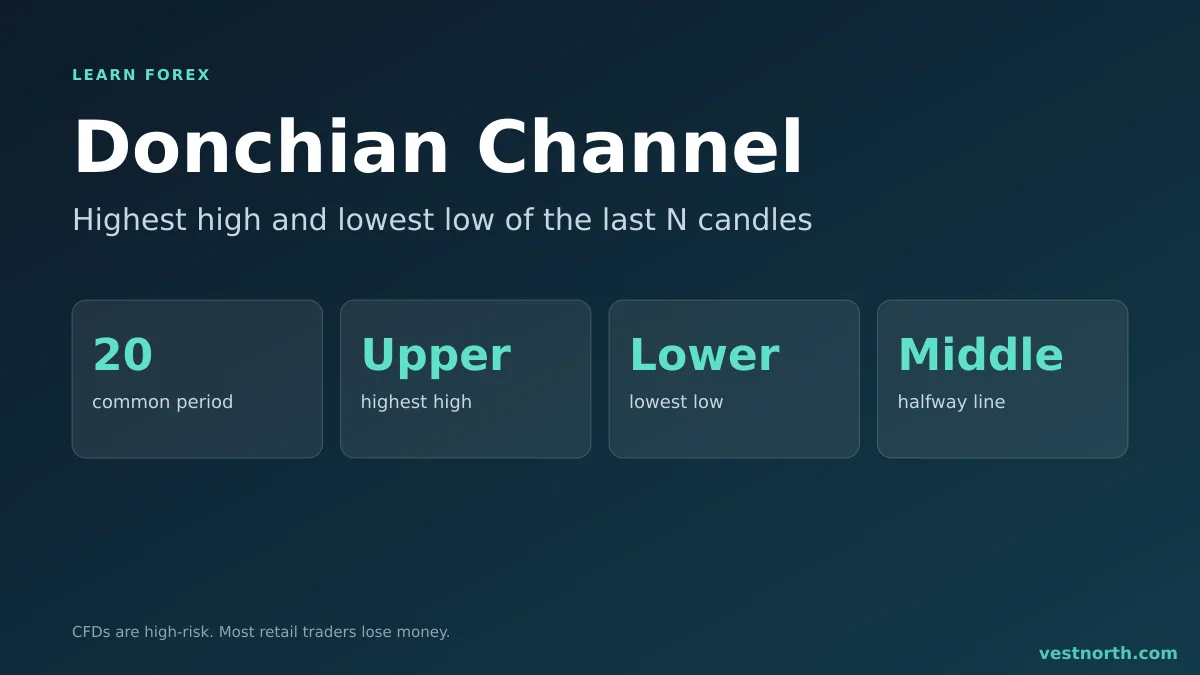
Donchian channel structure and a breakout. Illustration, November 2026.
How it is built
No averaging is involved. For each candle, look back N candles including the current one:
- Upper band: the highest high in that window
- Lower band: the lowest low in that window
- Middle line: (upper + lower) / 2
Suppose the last 20 candles on a 1-hour EUR/USD chart have a high of 1.0890 and a low of 1.0820. The upper band is 1.0890, the lower band is 1.0820, and the middle line is 1.0855. The channel is 70 pips wide.
Because it only uses extremes, the bands move in steps. They stay flat until price sets a new high or low, or until an old extreme drops out of the window. This is unlike Bollinger Bands, which curve with volatility. It also differs from a moving average, which averages every close.
What the width tells you
A narrow channel means price has stayed in a tight range for N candles. A wide channel means the range has been large. Traders read a narrow channel as a quiet market that may be preparing for a larger move, though it does not say which direction. For a number rather than a picture, the average true range measures the same thing in pips.
Breakout rules
The original use of the channel was trend following with fixed rules. A simple version:
- Enter long when a candle closes above the upper band (a new N-period high).
- Enter short when a candle closes below the lower band.
- Exit when price closes below the middle line, or touches a shorter band, such as the 10-period low for a long trade.
Using two different lengths is common: a 20-period band to enter, a 10-period band to exit. That lets winners run while cutting losers when the move stalls. We have not verified historical performance for any specific setting, so treat these as starting points to test.
This method is a form of breakout trading. All the usual problems apply, including the fakeout.
Worked example (illustrative figures)
On the 4-hour GBP/JPY chart, the 20-period Donchian channel has an upper band at 191.40, a lower band at 189.60 and a middle line at 190.50. A candle closes at 191.55.
| Item | Level | Distance |
|---|---|---|
| Entry (breakout close) | 191.55 | |
| Stop (middle line) | 190.50 | 105 pips |
| Alternative stop (lower band) | 189.60 | 195 pips |
| First target (2x risk with middle-line stop) | 193.65 | 210 pips |
On JPY pairs one pip is 0.01. The stop at the middle line is 105 pips. Risking 1% of a 10,000 USD account (100 USD) is about 0.95 USD per pip for a 105-pip stop. The USD value per pip depends on the current USD/JPY rate, so use the pip calculator to size it. If the lower band is used as the stop, the stop is 195 pips and the position has to be nearly half as large for the same risk. The prices are invented for the example and are not a signal.
This is the main design choice with the channel: a breakout is, by definition, far from the opposite band. A stop at the opposite band is wide, and a stop at the middle line is tighter but gets hit more often.
Where it struggles
- Ranges. In a sideways market, price touches the upper band, fails, and falls back. Each touch looks like a breakout and loses money. A trend filter, such as the ADX, can reduce false signals but not remove them.
- Late entries. A new 20-candle high is, by definition, after the move has started.
- Gaps and news. A release can push price through the band in one candle, with a worse fill than planned. See slippage and the economic calendar.
- Parameter choice. Different N values give different signals. Picking the one that fit last month’s chart is a form of over-fitting.
- Costs. On short timeframes, the spread takes a larger share of the move.
Donchian channel and other tools
| Tool | What it uses | Typical job |
|---|---|---|
| Donchian channel | Highest high and lowest low | Breakout levels and trailing exits |
| Bollinger Bands | Moving average and standard deviation | Volatility and mean reversion |
| ATR | Average candle range | Stop distance and position size |
| Support and resistance | Chart levels chosen by the trader | Entry and exit zones |
The Donchian bands are a mechanical version of drawing support and resistance at recent extremes. Compare with channel trading, where the channel is drawn by hand along trend lines.
Bottom line
The Donchian channel marks the highest high and lowest low over N candles, with a middle line between them. A close beyond a band is a mechanical breakout signal, and a shorter band can act as a trailing exit. It works best when price trends and does poorly in ranges, so test the settings on past charts and a demo account before using real money. Size each trade from the stop distance. Only risk money you can afford to lose. CFDs are complex, high-risk instruments.
Frequently asked questions
What is the Donchian channel?
It is an indicator with three lines: an upper band at the highest high of the last N candles, a lower band at the lowest low of the last N candles, and a middle line halfway between them.
How is the Donchian channel calculated?
Upper band = highest high over N periods. Lower band = lowest low over N periods. Middle line = (upper + lower) / 2. There is no smoothing and no standard deviation.
What setting is most common?
Twenty periods is a widely used default, with 55 used for longer-term versions of the same idea. These are conventions, so test other values on your pair and timeframe.
How is it different from Bollinger Bands?
Bollinger Bands use a moving average and standard deviation, so they widen and narrow with volatility. Donchian bands only follow the extreme highs and lows, so they move in steps and never cut through the price range.
Is a Donchian breakout a buy signal?
A close above the upper band is a breakout signal under Donchian rules. In practice many breakouts fail, especially in ranges, so traders add filters such as trend direction and stop placement.
Where does the stop loss go?
Some traders use the opposite band or the middle line, others use a multiple of the average true range. The choice sets how wide the stop is, and position size must be reduced as the stop widens.
Does the Donchian channel repaint?
No. Once a candle closes, its band values are fixed. The current candle's band can change until it closes, because the high or low can still be updated.