What Is a Swing High and Swing Low in Forex? How to Mark Them and Use Them for Stops
Short answer: A swing high is a peak: a candle whose high is higher than the highs of the candles next to it. A swing low is the opposite, a trough with higher lows on both sides. Traders use them to read the trend, to mark levels and to place a stop loss beyond a point where the idea is clearly wrong.
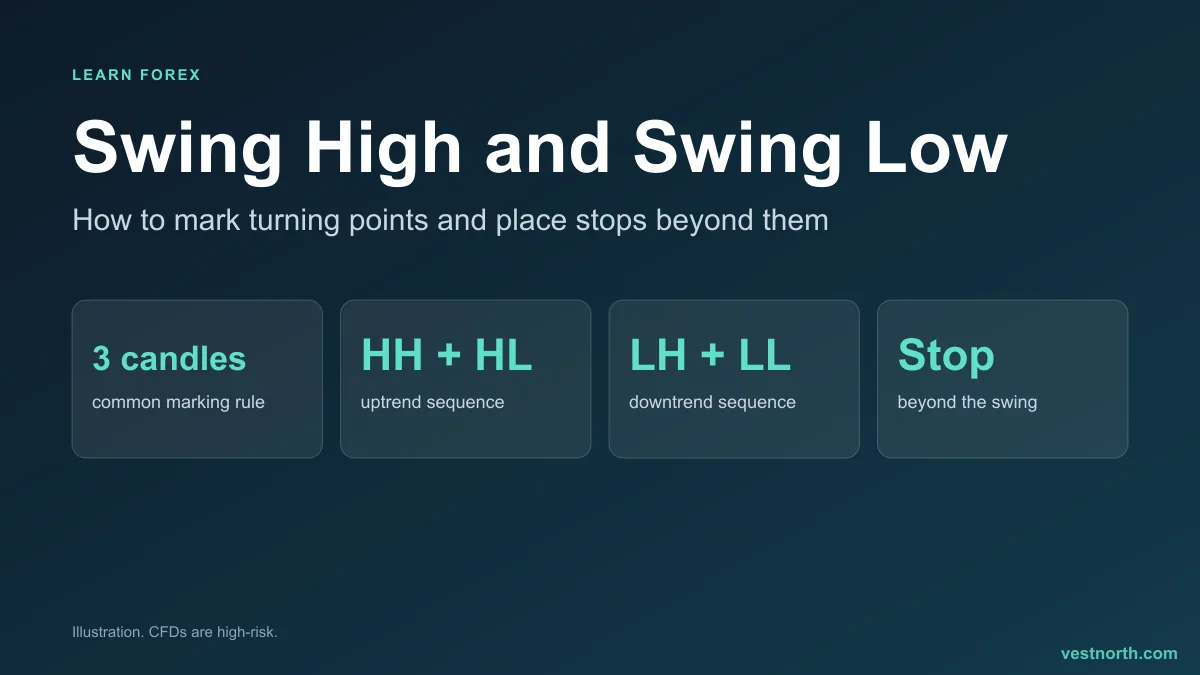
Swing highs and swing lows on an uptrend. Illustration, November 2026.
How to mark a swing point
Pick a simple, repeatable rule. A common one uses three candles:
- Swing high: the middle candle has the highest high of the three.
- Swing low: the middle candle has the lowest low of the three.
Some traders require two candles on each side instead, which means five candles in total. The more candles you require, the fewer swing points you get, and the bigger each one is. Neither choice is correct. What matters is that you use the same rule on every chart, so you do not mark points that happen to suit the trade you want.
A swing point is only confirmed after the candles on its right have closed. The newest candle can never be a confirmed swing high, because you do not yet know whether price will rise again. This delay is one reason swing points are better at describing what has happened than at predicting the next move.
Swing points define a trend
Read from left to right, swing points show the shape of the trend. This is the base of market structure.
| Market | Swing highs | Swing lows |
|---|---|---|
| Uptrend | Each higher than the last | Each higher than the last |
| Downtrend | Each lower than the last | Each lower than the last |
| Range | Roughly the same level | Roughly the same level |
An uptrend stays intact while price keeps making higher lows. If price falls below the most recent swing low, the sequence is broken. That does not prove a new downtrend, but it is the earliest common warning. The same idea runs in reverse for a downtrend and the last swing high. See trend trading basics for how traders build entries around this.
Which swing points matter
Charts show dozens of small swings. Not all of them deserve attention.
- Major swings are the large turning points on a higher time frame such as the 4-hour or daily chart. Price often reacts when it returns to them.
- Minor swings are the small zigzags inside a move. They are useful for placing a tight stop but are easily broken by normal noise.
- Swings that price has tested more than once carry more weight than a point touched a single time. This links directly to support and resistance.
A practical habit is to mark the major swings on the daily chart first, then drop to a lower time frame for entries. Trading with multiple timeframes covers that routine.
Using swing points for a stop loss
A stop placed at a random distance has no link to the chart. A stop beyond a swing point has a reason: if price goes there, the idea behind the trade has failed.
A worked example, with made-up prices on EUR/USD:
- Price rises from 1.0800 and pulls back, forming a swing low at 1.0850.
- It then climbs to 1.0950.
- A trader wants to buy a pullback to 1.0880 with the swing low at 1.0850 as the invalidation point.
- Stop loss: 1.0840, which is 10 pips below the swing low to leave room for spread and a brief dip. That is 40 pips from the 1.0880 entry.
- Target idea: the earlier high at 1.0950 is 70 pips away. The reward-to-risk ratio is 70 / 40, about 1.75 to 1.
With a $1,000 account and a 1% risk rule ($10), a 40-pip stop allows about 0.025 lot, which is about $0.25 per pip. The lot size calculator shows the formula, and position sizing explains the steps. The size follows from the stop, not the other way round.
If the swing low is far away, the stop is wide and the lot size must be small. If you cannot accept that, skip the trade instead of moving the stop closer. A stop placed inside normal noise is often hit by a stop hunt or a brief wick.
Common mistakes
- Changing the rule to fit a trade. Decide the number of candles in advance.
- Treating every swing as a level. Only points that price has reacted to more than once are worth watching.
- Stop exactly on the swing point. Price often touches or slightly pierces a visible level. Leave a buffer, and see what is a stop loss for how stops work.
- Ignoring the time frame. A swing low on a 5-minute chart means little against a daily trend.
- Calling a break a reversal. A close below the last swing low in an uptrend is a warning. It can also be a fakeout that reverses within a few candles.
Practice before real money
Open a chart of one pair, pick a time frame and a candle rule, and mark the last 15 swing highs and lows. Note how many of them price later reacted to. Then check where a stop beyond each swing would have sat and how large the distance was. A demo account lets you try entries with no risk; see demo accounts.
Bottom line
Swing highs and swing lows are the turning points that give a price chart its shape. They show whether the market is trending or ranging and give stops a logical location. Use one clear rule to mark them, give more weight to points on higher time frames, and size every trade from the distance to the stop. Only risk money you can afford to lose. CFDs are complex, high-risk instruments.
Frequently asked questions
What is a swing high in forex?
A swing high is a candle high that is higher than the highs of the candles on both sides of it. It marks a point where price rose, stopped and turned down.
What is a swing low?
A swing low is a candle low that is lower than the lows of the candles on both sides of it. It marks a point where price fell, stopped and turned up.
How many candles do I need on each side?
There is no standard. Many traders use two or three candles on each side. More candles give fewer, larger swings; fewer candles give more, smaller ones. Pick one rule and keep it.
How do swing points show a trend?
An uptrend is a sequence of higher swing highs and higher swing lows. A downtrend is lower swing highs and lower swing lows. A break of the last swing low in an uptrend is an early warning.
Where do traders put a stop loss with swing points?
Many place it just beyond the last swing low for a buy, or just beyond the last swing high for a sell, with extra room for the spread and normal noise.
Are swing highs and lows the same as support and resistance?
They are related. A swing low that price later returns to can act as support, and a swing high can act as resistance. A single swing point is not a guaranteed level.