The Three Line Strike Candlestick Pattern in Forex: How to Read and Trade It
Short answer: The three line strike is a four-candle pattern. Three candles in a row close in the same direction, then a fourth, large candle of the opposite colour opens near the third close and closes beyond the open of the first. The bullish version has three falling candles and one big rising candle. The bearish version is the mirror image. Traditional candlestick books read it as a signal that the earlier direction may resume, but the evidence is mixed, so confirm it with the trend and a nearby level.
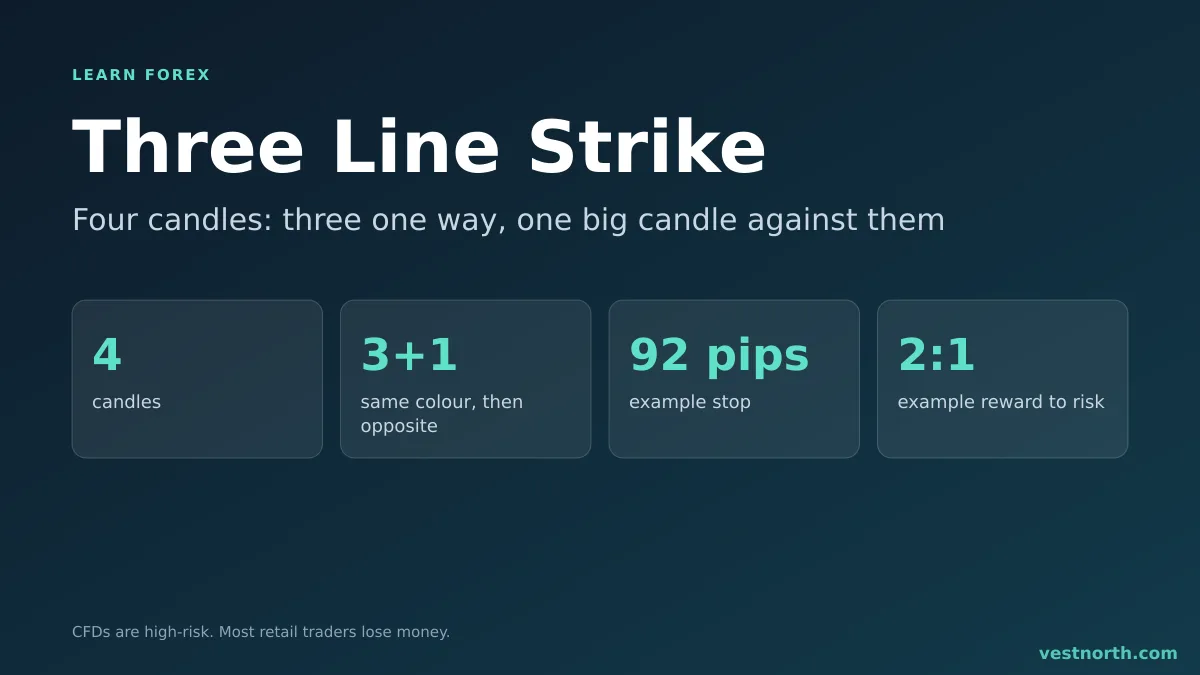
Three line strike structure, bullish version. Illustration, November 2026.
How the pattern forms
Bullish version:
- Three consecutive bearish candles, each closing lower than the one before.
- A fourth bullish candle that opens at or below the third close and closes above the open of the first candle.
Bearish version:
- Three consecutive bullish candles, each closing higher.
- A fourth bearish candle that opens at or above the third close and closes below the open of the first.
The fourth candle wipes out all three earlier candles in one move. That is why it looks dramatic on a chart. If you know the engulfing candle, this is the same idea stretched across three candles.
Why the name confuses people
Most reversal patterns show a falling market followed by a rising signal candle, and traders expect a turn. The three line strike looks like a reversal, because the last candle goes against the previous three. Yet the classic reading is the other way round. After three bullish candles and a sharp bearish one, the traditional view says the prior uptrend is likely to continue, and that the bearish candle was a shakeout.
Not every source agrees. Some traders treat the fourth candle as the start of a real reversal. We have not found a verified, primary-source statistic that settles the question, so this page treats the pattern as a prompt to look closer, not as a rule.
How traders read it
The pattern alone is weak. Traders usually add context:
- Trend. A bullish three line strike that appears inside an uptrend, after a pullback, fits the continuation reading. See trend trading.
- Location. A signal at a known level carries more weight than one in the middle of nowhere. Check support and resistance.
- Size of the fourth candle. A body much larger than the previous three, with a small wick, suggests a decisive move. A fourth candle that barely engulfs the first is weaker.
- Confirmation. Some wait for the next candle to close in the same direction before acting.
Compare with the three-candle trend patterns in three white soldiers and three black crows. Those show steady pressure. The three line strike shows steady pressure followed by a sudden counter-move.
Worked example (illustrative figures)
On the 4-hour EUR/USD chart, price is in an uptrend and pulls back with three bearish candles from 1.0900 to 1.0830. A fourth bullish candle opens at 1.0828 and closes at 1.0912, above the first candle’s open of 1.0900.
| Item | Level | Distance |
|---|---|---|
| Entry (after the fourth candle closes) | 1.0912 | |
| Stop (below the fourth candle low) | 1.0820 | 92 pips |
| Target (twice the risk) | 1.1096 | 184 pips |
| Reward to risk | 2 to 1 |
A 92-pip stop is wide. Risking 1% of a 10,000 USD account (100 USD) gives about 1.09 USD per pip, or roughly 0.11 lot where one pip is 10 USD per lot. Try the lot size calculator for your own account. The prices are invented for illustration and are not a recommendation.
Notice the cost of the large fourth candle: the wider the candle, the wider the stop, and the smaller the position has to be. Some traders skip the setup when the stop would exceed a fixed number of pips, or enter on a pullback into the fourth candle instead of at its close.
Common mistakes
- Trading it in a range. In a sideways market the pattern carries little information. See range markets.
- Counting loosely. Three candles that are mostly bearish with one small bullish candle in between do not qualify. Define the rule and apply it the same way each time.
- Ignoring the spread. On short timeframes the spread eats a larger share of a small candle. See what is a spread.
- Entering after the news. If the fourth candle came from a data release, it may reflect a one-off event. Check the economic calendar.
- No stop. The large fourth candle makes it tempting to widen or remove the stop. Read stop loss before you trade.
Testing the pattern
Because there is no confirmed success rate to lean on, test it yourself. Scroll back through 50 or more occurrences on one pair and timeframe. Record what happened over the next 5 to 10 candles, including the size of losers. Then repeat on a demo account and record each trade in a journal. A small sample can flatter any pattern.
Bottom line
The three line strike is a four-candle pattern in which one large candle reverses three small ones of the opposite colour. Books usually read it as a possible continuation of the earlier trend, though opinions differ and no reliable statistic backs either view. Use it with trend and level context, size the position from the stop distance, and test it on past charts first. Only risk money you can afford to lose. CFDs are complex, high-risk instruments.
Frequently asked questions
What is the three line strike pattern?
It is a four-candle pattern. Three candles of the same colour move in one direction, then a fourth, larger candle of the opposite colour opens near the third close and closes beyond the first candle's open.
Is the three line strike bullish or bearish?
Both versions exist. The bullish version has three falling candles and a large rising one. The bearish version has three rising candles and a large falling one. Traditionally, the fourth candle is read as a sign that the prior move may continue, which is counter-intuitive.
Does the pattern predict a reversal or a continuation?
Sources differ. Many describe the bullish version as a continuation signal in an uptrend, while others treat the fourth candle as the start of a reversal. We have no verified statistic for either. Treat it as one piece of evidence and confirm with the trend and a nearby level.
How is it different from three white soldiers?
Three white soldiers is a three-candle pattern of rising candles. The three line strike adds a fourth candle that reverses against those three, so the setup looks like the opposite of a clean trend.
Where should the stop loss go?
A common choice is beyond the extreme of the large fourth candle, with a small buffer for spread. Position size is then set from that distance.
Which timeframe is best?
The pattern can appear on any timeframe. Higher timeframes such as the 4-hour and daily charts produce fewer but less noisy signals than the 5-minute chart.
How often does the pattern work?
We could not confirm a reliable success rate from a primary source. Results depend on market, timeframe and filters, so test it on past charts and a demo account before relying on it.