Rate of Change (ROC) in Forex: Formula, Worked Example and Where It Fails
Short answer: Rate of change (ROC) compares the latest close with the close N candles ago and shows the gap as a percentage around a zero line. With EUR/USD at 1.1100 now and 1.1000 ten candles ago, ROC(10) is about +0.91. A reading above zero means price is higher than N candles back, below zero means lower. Traders use it to judge momentum and to spot when a move is slowing.
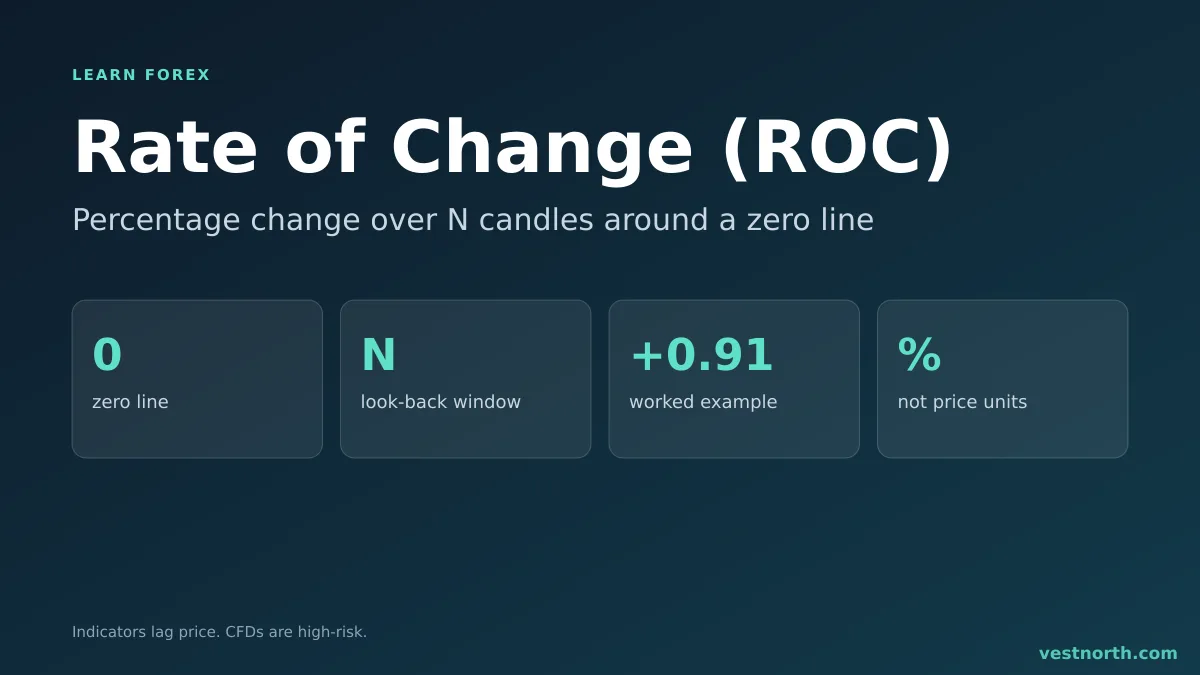
ROC oscillating around its zero line. Illustration, November 2026.
The ROC formula
ROC = (latest close - close N periods ago) / close N periods ago x 100
| Input | Meaning |
|---|---|
| Latest close | The close of the candle being measured |
| Close N periods ago | The close N candles back on the same chart |
| N | The look-back window the trader sets, such as 9, 12 or 14 |
| Output | A percentage, positive or negative, drawn in a window under the chart |
Because the result is a percentage, a 0.5 reading means the same relative move on EUR/USD, USD/JPY or gold. That is the practical difference from the plain momentum indicator, which reports a raw price difference.
A worked example
These are made-up prices to show the arithmetic. It is not a real trade.
- On the 4-hour chart of EUR/USD, ROC(10) uses the close 10 candles back, 1.1000. The latest close is 1.1100.
- ROC = (1.1100 - 1.1000) / 1.1000 x 100 = +0.91.
- Two candles later the close is 1.1120 and the close 10 candles back has rolled forward to 1.1040. ROC = (1.1120 - 1.1040) / 1.1040 x 100 = +0.72.
Price kept rising, yet ROC fell from 0.91 to 0.72. The indicator compares against a moving reference point, so it can slow down while price still makes new highs. That falling reading is what traders call fading momentum, and it is a warning to check the chart, not a sell signal.
Ways traders read ROC
- Zero-line cross. A move from below zero to above it means price has risen over the window. Some traders treat that as a sign of an upturn in momentum, others wait for a close above a recent swing high.
- Divergence. Price makes a higher high while ROC makes a lower high. It suggests the push is weaker. Divergence can last a long time in a strong trend.
- Extremes. There are no fixed overbought or oversold lines. Traders mark the highest and lowest ROC readings on their own chart and treat those as local extremes for that pair and time frame.
ROC is a cousin of the RSI, but RSI is bounded between 0 and 100 and ROC is not. A big news move can push ROC far past anything seen in the previous weeks.
Choosing the window
A short window such as 5 reacts fast and gives many zero-line crosses, most of them noise in a sideways market. A longer window such as 25 is smoother and later. Pick one value for a pair and time frame and keep it fixed while you test, or you will end up fitting the indicator to the last few weeks of chart.
Where it fails
- Lag. Both closes are in the past, so ROC confirms a move after it has started.
- Whipsaws in ranges. In a range market ROC crosses zero again and again.
- Base effect. When a big candle drops out of the window, ROC can jump even if the latest candle is quiet.
- No stop level. ROC says nothing about where a trade is wrong. That comes from the chart.
- News. A data release can send a reading far outside its normal span in one candle.
Using it in a plan
- Decide whether the market is trending or ranging, using moving averages or the structure of highs and lows.
- Use ROC as a filter, for example trade only in the direction of its side of zero.
- Place a stop loss from the chart, not from the indicator.
- Size the trade from the stop distance with the lot size calculator.
- Run the plan on a demo account before using real money.
Bottom line
ROC is a simple percentage comparison between two closes. It is useful for seeing whether momentum is rising or fading and for comparing pairs on one scale. It lags, it whipsaws in ranges, and it has no built-in exit. Fix one window, read it alongside price structure, and put a stop loss on every trade. Only risk money you can afford to lose. CFDs are complex, high-risk instruments.
Frequently asked questions
What is the rate of change indicator in forex?
ROC is a momentum oscillator. It shows the percentage change between the latest close and the close a set number of candles earlier, plotted around a zero line.
What is the ROC formula?
ROC = (latest close - close N periods ago) / close N periods ago x 100. If EUR/USD closes at 1.1100 and closed at 1.1000 ten candles ago, ROC(10) is about +0.91.
What does a ROC above zero mean?
Price is higher than it was N candles ago. A reading below zero means price is lower than it was N candles ago. The further from zero, the larger the move over that window.
What period should I use for ROC?
There is no standard. Many platforms and books use 9, 12 or 14, but the right window depends on the pair and time frame. Keep one value fixed during a test.
How is ROC different from momentum?
The classic momentum indicator subtracts the old close from the new one, giving a price difference. ROC divides by the old close and gives a percentage, so readings are comparable across pairs.
Is ROC a reliable signal on its own?
No. It is built from past closes, so it confirms a move after it has started and often turns late. We have no verified statistics to quote. Test it on a demo account and use a stop loss.