Pivot Points vs Fibonacci Levels in Forex: How They Are Calculated and When They Overlap
Short answer: Pivot points are worked out by formula from the previous session’s high, low and close, so the lines are the same for everyone using the same formula. Fibonacci retracement levels (38.2%, 50%, 61.8%) are drawn on a swing you choose, so they differ between traders. In the EUR/USD example below, a 50% retracement at 1.0850 lands 3 pips from the pivot at 1.0853. Both are reference levels, and price can ignore either.
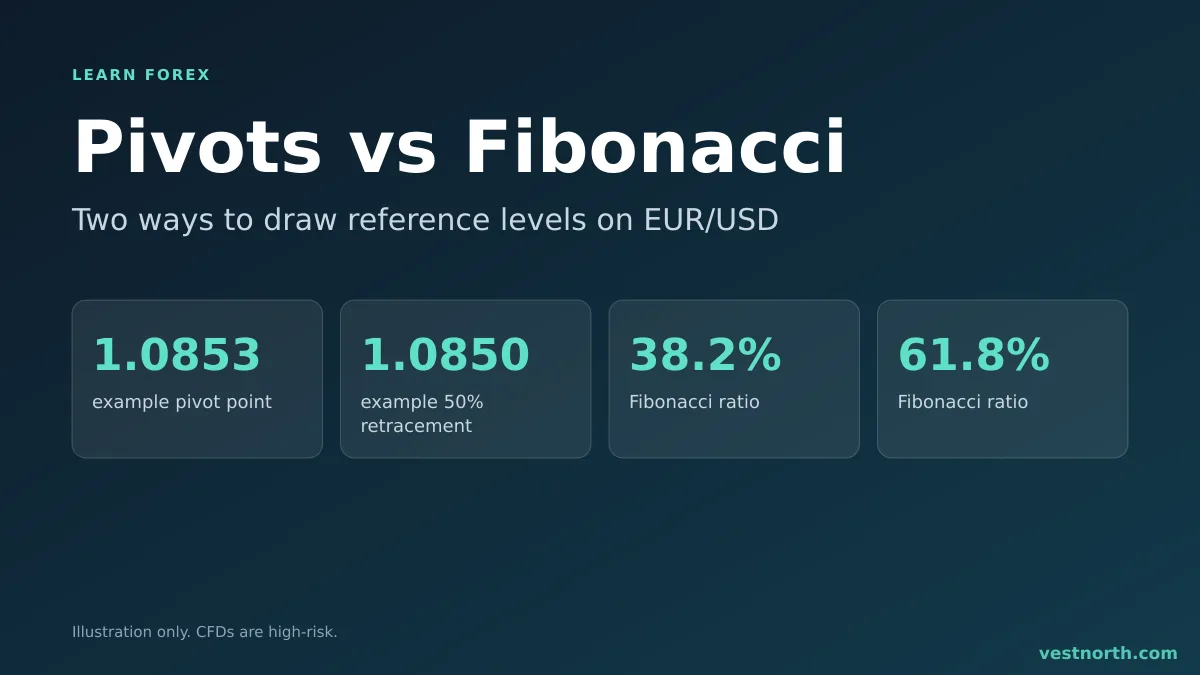
Pivot lines and Fibonacci levels on one chart. Illustration, November 2026.
How each one is built
| Pivot points | Fibonacci retracement | |
|---|---|---|
| Input | Previous session high, low, close | One swing low and swing high you pick |
| Judgment needed | Almost none, only the formula and day cut-off | Yes, the choice of swing |
| Levels | P, S1, S2, R1, R2 (classic) | 23.6%, 38.2%, 50%, 61.8%, 78.6% |
| Same for every trader | Yes, if the formula and day cut-off match | No |
| Where it is used | Daily reference lines, targets | Measuring how deep a pullback went |
The full formulas are in the pivot points guide and the Fibonacci retracement guide. Platforms differ on the day cut-off and on which pivot version they draw, so check yours.
Both calculated on the same EUR/USD data
These are made-up prices. Yesterday EUR/USD printed a high of 1.0900, a low of 1.0800 and a close of 1.0860. The range is 100 pips.
Classic pivots
| Level | Calculation | Price |
|---|---|---|
| R2 | P + (High - Low) | 1.0953 |
| R1 | (2 x P) - Low | 1.0907 |
| Pivot (P) | (1.0900 + 1.0800 + 1.0860) / 3 | 1.0853 |
| S1 | (2 x P) - High | 1.0807 |
| S2 | P - (High - Low) | 1.0753 |
Fibonacci pivots use the same P, then add or subtract fractions of the range: R1 = P + 0.382 x range = 1.0892, R2 = P + 0.618 x range = 1.0915, S1 = P - 0.382 x range = 1.0815 and S2 = P - 0.618 x range = 1.0792. Many platforms also draw a third line at 100% of the range.
Fibonacci retracement is different. Take the move from the low of 1.0800 up to the high of 1.0900 and measure the pullback from the top:
| Retracement | Pullback | Price |
|---|---|---|
| 38.2% | 38 pips | 1.0862 |
| 50% | 50 pips | 1.0850 |
| 61.8% | 62 pips | 1.0838 |
When the levels overlap
The 50% retracement at 1.0850 and the classic pivot at 1.0853 are 3 pips apart. Traders who follow both treat that as one zone around 1.0850. Here is how one might plan it, as an arithmetic example and not a real trade.
- Today price pulls back from the high. A bullish candle closes at 1.0855 inside the zone. Entry: 1.0855.
- Stop loss: 1.0825, below the 61.8% level of 1.0838 with a margin. That is 30 pips.
- Target: classic R1 at 1.0907, 52 pips away. The ratio is about 1.7 to 1.
- On a $1,000 account, 1% is $10. A 30-pip stop sized to that is about 0.03 lot, which is $0.30 per pip, so a stop-out costs about $9. The lot size calculator does the same sum.
An overlap makes a level easier to see. Many traders watching the same area can matter, but no source shows that overlapping levels hold more often, and we have no statistics to quote.
Which one to use
- Pivot points suit traders who want fixed daily reference lines and targets that need no drawing. They work as a map of where the previous day traded.
- Fibonacci retracement suits traders who follow a trend and want to measure a pullback.
- Neither replaces support and resistance drawn from real swing highs and lows.
Limits of both
- Subjectivity. Fibonacci levels change with the swing you pick. Draw the same chart twice with different swings and you get different zones. Pivot lines change with the day cut-off.
- Too many lines. With classic pivots, Fibonacci pivots and retracements on one chart, almost every price is near some level. Overlap then means little.
- News. A data release can send price through several levels in seconds. See the economic calendar.
- Trends. In a strong move, price can run through several levels without a pause.
- Hindsight. Levels that held look obvious afterwards. Levels that failed are forgotten.
Using them in a plan
- Choose one pivot formula and one swing rule, and write them down.
- Mark levels before the session starts, not after price reaches them.
- Wait for a candle to close at the level before entering.
- Put the stop beyond the next level and skip trades where the target is smaller than the stop.
- Practise on a demo account first.
Bottom line
Pivot points and Fibonacci retracement both turn past prices into reference lines. Pivots are fixed by formula, and Fibonacci levels depend on the swing you choose. Where they overlap, the zone is easier to see, and nothing more can be said for it. Write your rules before the trade and size every position from the stop distance. Only risk money you can afford to lose. CFDs are complex, high-risk instruments.
Frequently asked questions
What is the difference between pivot points and Fibonacci levels?
Pivot points are calculated by formula from the previous session's high, low and close, so every trader with the same formula sees the same lines. Fibonacci retracement levels depend on which swing high and swing low you choose, so two traders can draw different levels.
What are Fibonacci pivot points?
They are a pivot variant. The pivot is the same (high + low + close) divided by 3, but the support and resistance lines sit at 38.2%, 61.8% and 100% of the previous range from the pivot.
Which is better for forex, pivot points or Fibonacci?
Neither is better in general. We know of no verified evidence that either one predicts turning points. Pivot points suit a fixed daily reference, and Fibonacci suits measuring a pullback inside a trend.
Can I use both together?
Many traders do. When a pivot level and a Fibonacci level fall within a few pips of each other, they treat the area as one zone. The overlap makes the zone easier to see, and it does not make it more likely to hold.
Do pivot points work on any time frame?
The formula works on any period, but daily pivots are the most common. A weekly pivot uses last week's high, low and close. Because forex trades 24 hours, the daily cut-off on your platform changes the numbers.
Do these levels guarantee a bounce?
No. Price can stop at a level, run through it, or turn before it. Use a stop loss on every trade.