Stochastic RSI in Forex: How It Is Calculated, How Traders Read It and Where It Fails
Short answer: Stochastic RSI applies the stochastic formula to RSI values instead of price: (RSI - lowest RSI) / (highest RSI - lowest RSI) over a recent window. Many platforms use 14 for both windows and 3 for smoothing. In the worked example below, an RSI of 56 inside a range of 38 to 62 gives a stochastic RSI of 75. It is very sensitive, which means many signals and many false ones.
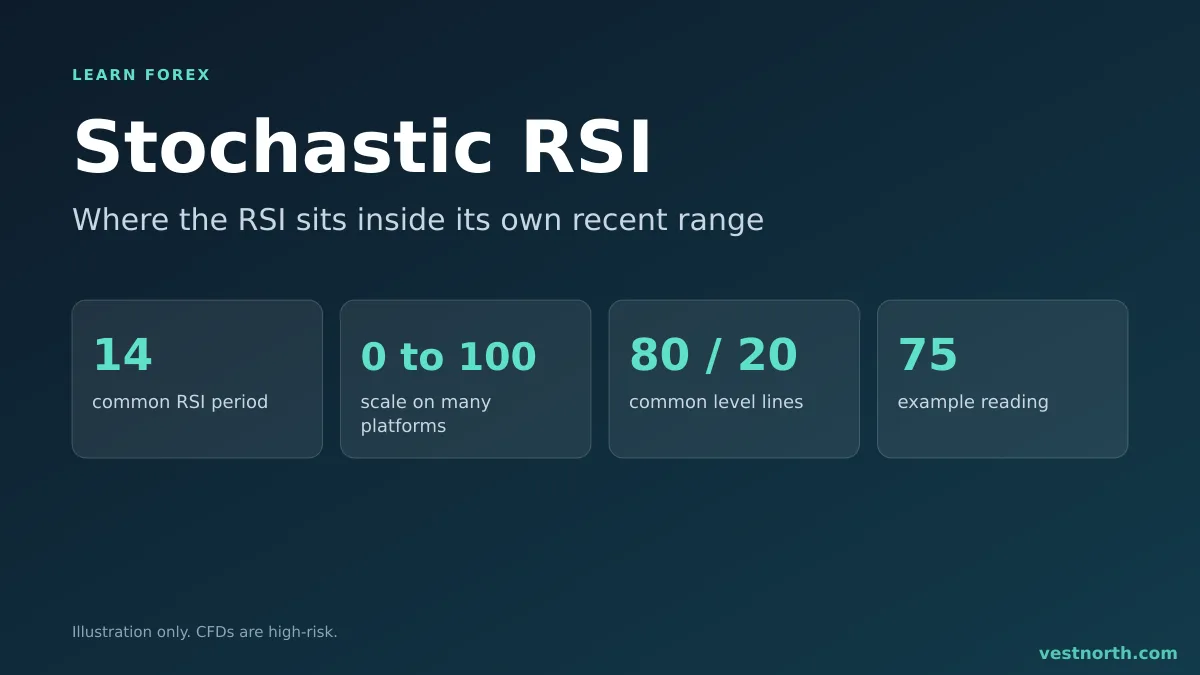
Stochastic RSI plotted under a price chart. Illustration, November 2026.
How it is calculated
You start with the RSI, which runs from 0 to 100. Then you apply the same idea as the stochastic oscillator, but to the RSI line instead of to price.
| Step | Calculation |
|---|---|
| 1 | Calculate the RSI, usually 14 periods |
| 2 | Find the highest and lowest RSI over the last N candles |
| 3 | StochRSI = (RSI - lowest RSI) / (highest RSI - lowest RSI) |
| 4 | Smooth the result, then smooth again to get the signal line |
Some platforms show the result from 0 to 1 and others from 0 to 100. The lines are then drawn at 0.8 and 0.2, or at 80 and 20. The meaning is the same.
A worked example
These are made-up numbers to show the arithmetic.
- Over the last 14 candles, the lowest RSI was 38 and the highest was 62. The range is 24 points.
- The current RSI is 56. StochRSI = (56 - 38) / 24 = 0.75, which is 75 on a 0 to 100 scale.
- On the next candle the RSI rises 4 points to 60. StochRSI = (60 - 38) / 24 = 0.917, which is 92.
The RSI moved from 56 to 60, a small change that stays in the middle of the RSI scale. The stochastic RSI jumped 17 points. That is the point of the indicator: it magnifies small RSI moves. It is also why it crosses its lines so often.
If the RSI ever sets a new high of the window, the result is 100 at that moment. A new low gives 0.
Why it is so sensitive
You are measuring a measurement. RSI already smooths price. StochRSI then stretches the recent RSI range to fill the full scale, however narrow the range is. A quiet market with an RSI between 48 and 52 still produces readings from 0 to 100. The scale shows position inside the recent range and carries no information about how large the move was.
How traders read it
- Pullback timing in a trend. In an uptrend (price above a rising moving average), a drop below the 20 line followed by a turn up can mark the end of a pullback.
- Line crosses. The main line crossing its smoothed signal line is the common trigger, as with the stochastic oscillator.
- Stretched readings in a range. In a sideways market, readings near 80 or 20 are read as price near the edge of the range.
The same reading above 80 is a sell idea in a range and a sign of strength in an uptrend. Decide which market you are in first.
A worked trade plan
This is an arithmetic example, not a real trade.
- EUR/USD is in an uptrend on the 1-hour chart, above a rising 50-period moving average.
- Price pulls back and the stochastic RSI falls below 20. Then the main line crosses above the signal line. A bullish candle closes at 1.0820. Entry: 1.0820.
- Stop loss: 1.0790, below the pullback low. That is 30 pips.
- Target idea: the previous high at 1.0880, 60 pips away. The ratio is 2 to 1.
- On a $1,000 account, 1% risk is $10. A 30-pip stop sized to that is about 0.03 lot, or $0.30 per pip. A stop-out costs about $9.
See position sizing for why the stop sets the size.
Where it fails
- Too many signals. The indicator reaches the extremes quickly and often. Most crosses lead nowhere.
- Strong trends. It can stay above 80 for a long time in an uptrend. Selling each reading above 80 is a common way to lose money.
- It lags. It is built on the RSI, which is built on past prices.
- Settings. Shorter windows give more signals and more noise. Tuning to fit past data often gives settings that do not repeat.
- News. A data release can pin the indicator at one extreme or flip it in a single candle.
Using it in a plan
- Decide first if the market is trending or ranging.
- Use it for timing inside a trend you already identified, not as a stand-alone signal.
- Wait for a candle close and a cross, and set a stop loss before entering.
- Skip setups where the target is smaller than the stop.
- Practise on a demo account before using real money.
Bottom line
Stochastic RSI shows where the RSI sits inside its own recent range. That makes it quick to react and prone to false signals, so it works better as a timing tool inside a trend you already see than as a signal on its own. Fix your settings, use a stop loss on every trade and size the position from the stop distance. Only risk money you can afford to lose. CFDs are complex, high-risk instruments.
Frequently asked questions
What is the stochastic RSI?
It is an indicator that applies the stochastic formula to RSI values instead of to price. It shows where the current RSI sits inside its own recent high-low range, on a scale of 0 to 1 or 0 to 100 depending on the platform.
What is the stochastic RSI formula?
StochRSI = (current RSI - lowest RSI over N periods) / (highest RSI over N periods - lowest RSI over N periods). If the RSI is at its highest of the window, the result is 1 (or 100). At its lowest, it is 0.
What are the usual stochastic RSI settings?
Many platforms use 14 for the RSI, 14 for the stochastic window, and 3 for each smoothing step. Platforms differ, so check what yours uses. We know of no setting that works on every pair.
How is stochastic RSI different from RSI?
RSI measures the speed of price changes on a 0 to 100 scale. Stochastic RSI measures where that RSI value sits within its own recent range, so it moves between extremes much more often.
What do the 0.8 and 0.2 lines mean?
Platforms often draw lines at 0.8 and 0.2 (or 80 and 20). A reading above the top line means the RSI is near the high of its recent range. In a strong trend it can stay there for a long time, so it is not a sell signal alone.
Is stochastic RSI reliable?
No indicator is reliable on its own. Because it is an indicator of an indicator, it gives many signals and many false ones. Use a stop loss and confirm with trend or support and resistance.