Piercing Line and Dark Cloud Cover in Forex: How to Read the Two-Candle Reversal
Short answer: The piercing line is a bullish two-candle reversal that follows a decline. Dark cloud cover is its bearish mirror after an advance. In both, the second candle reaches past the midpoint of the first candle’s body but does not close beyond its open. That partial recovery is the whole signal, and on its own it is a weak one.
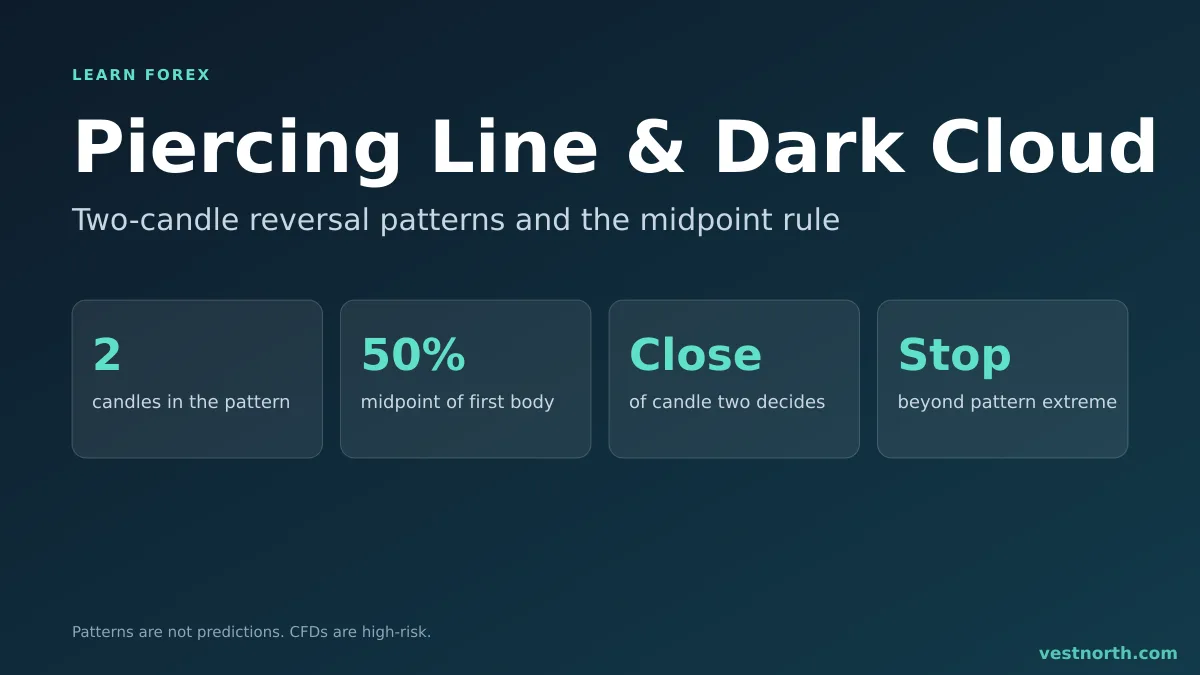
The midpoint rule in one picture. Illustration, November 2026.
The piercing line rules
A piercing line has two candles and four conditions:
- The market has been falling, so there is a downtrend to reverse.
- Candle one is a long bearish candle.
- Candle two is bullish and opens at or below the close of candle one. The textbook says below its low.
- Candle two closes above the midpoint of candle one’s body but below its open.
If candle two closed above candle one’s open, you would have a bullish engulfing candle instead, which is the stronger version of the same idea. Candle two reaching only the midpoint says buyers pushed back hard but did not take back all of the previous fall.
The dark cloud cover rules
Flip everything:
- The market has been rising.
- Candle one is a long bullish candle.
- Candle two is bearish and opens at or above the close of candle one.
- Candle two closes below the midpoint of candle one’s body but above its open.
Candle two looks like a dark cloud covering part of the previous rise. A close below candle one’s open would make it a bearish engulfing candle.
Gaps in forex
Stock charts often gap between sessions, and the old rules assume a gap. Forex trades almost around the clock on weekdays, so the open of one candle is usually the close of the one before. The practical fix is to accept a second candle that opens at or very near the previous close, and put the weight on the close of candle two, which is the part of the pattern that counts.
The weekly open is the exception. A pattern that straddles the weekend can show a real gap, and spreads are often wider around that time, so treat those with extra care.
Worked example on EUR/USD
All prices are illustrative, not a forecast.
After a decline, a 1-hour candle opens at 1.0900 and closes at 1.0840. The body is 60 pips, and the midpoint is 1.0870. The next candle opens at 1.0838, dips to 1.0825, then closes at 1.0882.
| Check | Value | Passes? |
|---|---|---|
| Candle one is long and bearish | 60-pip body | Yes |
| Candle two opens at or below candle one’s close | 1.0838 vs 1.0840 | Yes |
| Close above the midpoint (1.0870) | 1.0882 | Yes |
| Close below candle one’s open (1.0900) | 1.0882 | Yes |
A trader who waits for confirmation might buy only after a later candle closes above 1.0882. Suppose the entry is 1.0890 and the stop is 1.0815, which is 10 pips under the pattern low of 1.0825 to allow for the spread. The stop distance is 75 pips.
With a $5,000 account risking 1% ($50), the pip value needed is $50 ÷ 75 = about $0.67 per pip. On EUR/USD with a USD account, 0.07 lot is about $0.70 per pip, so the loss at the stop would be roughly $52. The position sizing guide explains this step, and the risk per trade guide covers the 1% figure.
A target at 1.0965 is also 75 pips away, a reward-to-risk ratio of 1 before costs. Many traders want more, which would mean a target nearer 1.1040, but then they need price room to get there. See risk-reward ratio.
Piercing line versus similar candles
| Pattern | Candles | Second candle closes | Strength |
|---|---|---|---|
| Piercing line | 2 | Above the midpoint, below candle one’s open | Moderate |
| Bullish engulfing | 2 | Above candle one’s open | Stronger |
| Bullish harami | 2 | Inside candle one’s body | Weaker, indecision |
| Hammer | 1 | Long lower wick, small body | Depends on context |
The harami is the opposite case: the second candle stays inside the first. For general reading of single and multi-candle signals, start with candlestick basics.
What makes the signal stronger or weaker
- Location. A piercing line at a level that has held before, such as a prior low, carries more information than one in the middle of a range.
- Size of candle one. A long first body gives the midpoint rule meaning. A tiny first body makes it trivial to “pierce”.
- Close of candle two. A close well above the midpoint is cleaner than one that barely clears it.
- Volume or tick activity. Some traders look for busier trading on candle two. Forex has no central volume figure, so broker tick counts only describe that broker’s feed.
- Trend before it. A pattern after a long, steady fall says more than one after two small red candles.
Why these patterns often fail
Candlestick patterns are descriptions of what already happened. The piercing line shows one strong candle, and the next candle can reverse it. In a strong downtrend, buyers can briefly push back and then give way again, leaving you long near a local high and stopped out.
Other common problems:
- Entering on the pattern candle itself, before it closes. A candle that looks like a piercing line halfway through can finish below the midpoint.
- Ignoring the spread. On a small timeframe, a few pips of spread is a large share of a 15-pip stop.
- Reading every red-then-green pair as a signal. Most are noise.
- Trading it against a higher-timeframe trend, which the multiple timeframes guide covers.
We have not backtested these patterns and publish no win rate. If you want a number, test the rule on past charts on a demo account and count the results yourself, including costs.
A simple checklist
- Is there a clear move into the pattern?
- Is candle one long relative to recent candles?
- Did candle two close past the midpoint of candle one’s body, and stay below its open?
- Is the pattern at a level that mattered before, such as support or resistance?
- Where is the stop, and does the position size keep the loss within your limit?
- Does the spread leave enough room for the trade?
If any answer is no, skipping the trade is a valid decision.
Bottom line
The piercing line and dark cloud cover show a partial reversal: the second candle recovers more than half of the first body but not all of it. Count the midpoint, wait for the close, and place the stop beyond the pattern. Treat the signal as one input next to trend and levels, never as a promise of direction. Leveraged trading can lose money quickly, so only risk what you can afford to lose.
Frequently asked questions
What is a piercing line in forex?
It is a bullish two-candle pattern that appears after a decline. A long bearish candle is followed by a bullish candle that opens lower and closes above the midpoint of the first candle's body, without closing above its open.
What is dark cloud cover?
It is the bearish mirror image. After an advance, a long bullish candle is followed by a bearish candle that opens higher and closes below the midpoint of the first body, but not below its open.
How is a piercing line different from a bullish engulfing candle?
A bullish engulfing candle closes above the open of the previous bearish candle. A piercing line closes above the midpoint but stays below that open, so it is a weaker, partial reversal.
Do these patterns need a gap in forex?
The textbook version opens below the prior low, but the forex market trades almost around the clock and gaps are rare outside the weekend. Most traders accept an open at or just below the previous close.
Where should the stop loss go?
A common placement is just beyond the extreme of the pattern, below the low of the piercing candle or above the high of the dark cloud candle, with room for the spread.
Are piercing line signals reliable?
No candlestick pattern is reliable on its own. Results depend on the trend before it, nearby support or resistance, the timeframe and costs, so test it on a demo account before risking money.