Hull Moving Average in Forex: How It Is Calculated and What It Trades Off
Short answer: The Hull moving average (HMA) is a moving average built from three weighted averages to reduce lag. The formula is HMA(n) = WMA( 2 x WMA(price, n/2) - WMA(price, n), sqrt(n) ). It follows price more closely than a simple or exponential average of the same period, and the price of that speed is more noise and more false turns in a sideways market.
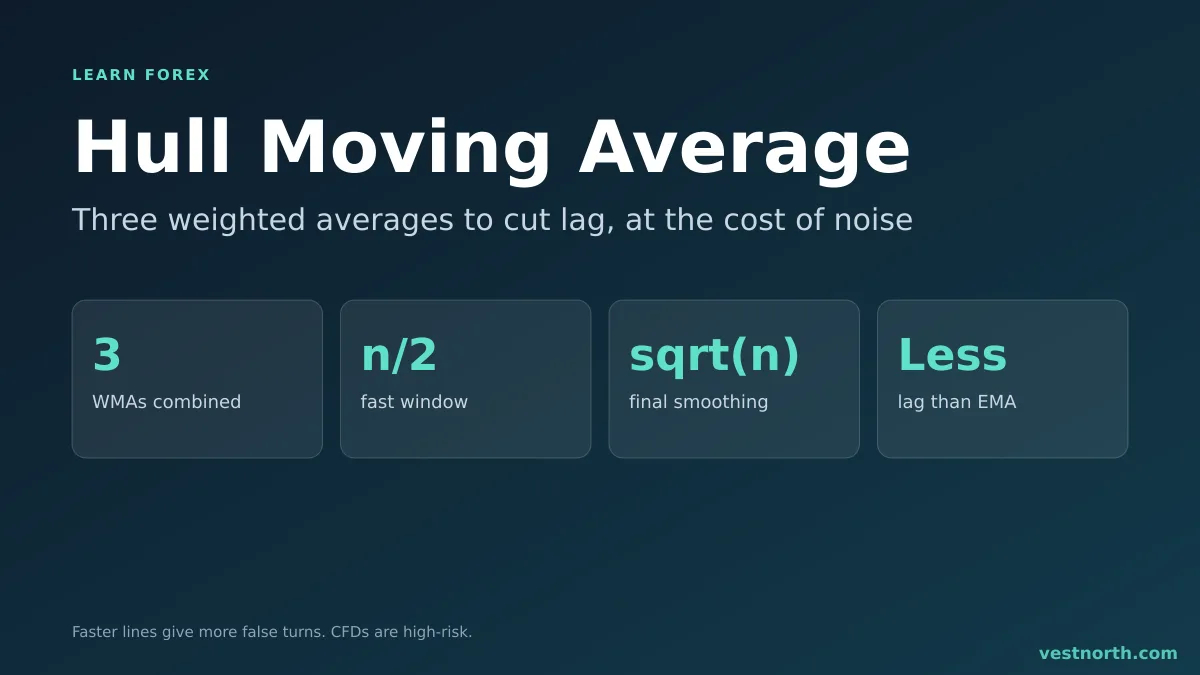
A Hull moving average hugging price. Illustration, November 2026.
How it is calculated
A weighted moving average (WMA) gives the newest candle the biggest weight. The Hull average uses three of them.
| Step | Calculation | Purpose |
|---|---|---|
| 1 | WMA of price over n/2 periods | A fast line |
| 2 | WMA of price over n periods | A slow line |
| 3 | 2 x step 1 - step 2 | Extrapolates, which cancels part of the lag |
| 4 | WMA of step 3 over sqrt(n) periods | Smooths the jumpy line from step 3 |
For n = 16: the fast line uses 8 periods, the slow line 16 periods, and the final smoothing uses 4 periods (the square root of 16). The shorter final window is why the Hull line stays close to price.
A worked example
These are made-up prices to show the arithmetic. It is not a real trade. Take n = 4, so the fast WMA uses 2 candles and the smoothing uses 2 candles.
- Closes (oldest to newest): 1.1000, 1.1010, 1.1030, 1.1050.
- WMA(4) of those closes: (1 x 1.1000 + 2 x 1.1010 + 3 x 1.1030 + 4 x 1.1050) / 10 = 1.1031.
- WMA(2) of the last two closes: (1 x 1.1030 + 2 x 1.1050) / 3 = 1.1043.
- Raw value: 2 x 1.1043 - 1.1031 = 1.1055.
The raw value sits above the last close of 1.1050 because the formula extrapolates the trend. The final step then averages the last two raw values to smooth it. Platforms do this automatically; the example only shows why the line can lead a normal average and even overshoot price at a sharp turn.
Ways traders read it
- Slope. Many platforms colour the line by direction. A turn from falling to rising is read as a shift in short-term direction.
- Price versus the line. Price closing above a rising line can be read as an uptrend. See trend trading basics.
- Two Hull lines. A fast and a slow Hull line crossing is the same idea as a moving average crossover, with less lag.
Hull versus the standard averages
| SMA | EMA | Hull (HMA) | |
|---|---|---|---|
| Weights | Equal | Newest heavier, exponential | Weighted, plus lag correction |
| Lag | Highest | Lower | Lowest of the three |
| Smoothness | Smoothest | Smooth | Can overshoot at turns |
| Typical issue | Late signals | Whipsaws in ranges | More false turns in ranges |
Less lag does not mean better results. Every move toward speed adds false signals, particularly in a range market.
Choosing the period
The period n sets both windows at once. A small n, such as 9, gives a line that turns on almost every pullback. A larger n, such as 55, ignores small pullbacks and turns late, though still sooner than a 55-period simple average. Because the final smoothing window is the square root of n, doubling n does not double the speed of the line. Pick the period from the time frame you trade, and compare it with a plain average on the same chart before deciding it adds anything.
Where it fails
- Whipsaws. In a sideways market the line turns often and each turn is a possible losing trade.
- Overshoot. At sharp reversals the extrapolation can push the line past price.
- Live candle. The line on the current candle moves with price, so a signal can vanish before the candle closes.
- Period fitting. A period that looks perfect on past data tends to disappoint on new data.
- News. A data release can flip the line within a single candle.
Using it in a plan
- Choose one period per time frame and keep it fixed while you test.
- Act on closed candles only.
- Use support and resistance to pick entries and a stop loss to define risk.
- Size the trade with the lot size calculator.
- Run the plan on a demo account first.
Bottom line
The Hull moving average trades smoothness for speed. It tracks price closely through a three-step weighted formula, so it turns earlier than a normal average and produces more false turns. Use closed candles, keep one period during testing, and pair it with a stop loss and a position size based on the stop. Only risk money you can afford to lose. CFDs are complex, high-risk instruments.
Frequently asked questions
What is the Hull moving average?
It is a moving average developed by Alan Hull. It combines three weighted moving averages so the line follows price more closely than a standard moving average of the same period.
What is the Hull moving average formula?
HMA(n) = WMA( 2 x WMA(price, n/2) - WMA(price, n), square root of n ). The first part cancels some lag, the last WMA smooths the result.
Is the Hull moving average faster than an EMA?
Usually it reacts sooner than a simple or exponential average of the same period, because the formula removes part of the lag. The cost is more noise and more false turns.
What Hull moving average period should I use?
There is no standard. A period of 9 is common on short charts and 21 or 55 on slower ones, but check your platform's default and test one value at a time.
Does the Hull moving average repaint?
The value for a closed candle does not change. The value on the current candle updates as price moves, and the line can change direction within that candle.
Can the Hull moving average be used alone?
It shows direction, not a stop level or a target. Add support and resistance, a stop loss and position sizing. Test any plan on a demo account first.