Forex Currency Correlation: Why Two Trades Can Be One Bet
Short answer: Currency correlation is a number from -1 to +1 that shows how closely two pairs move together. Near +1 they usually move the same way, near -1 they usually move in opposite ways, and near 0 there is no steady link. It matters because two open trades that share a currency can act like one larger trade, so your real risk can be double what you planned.
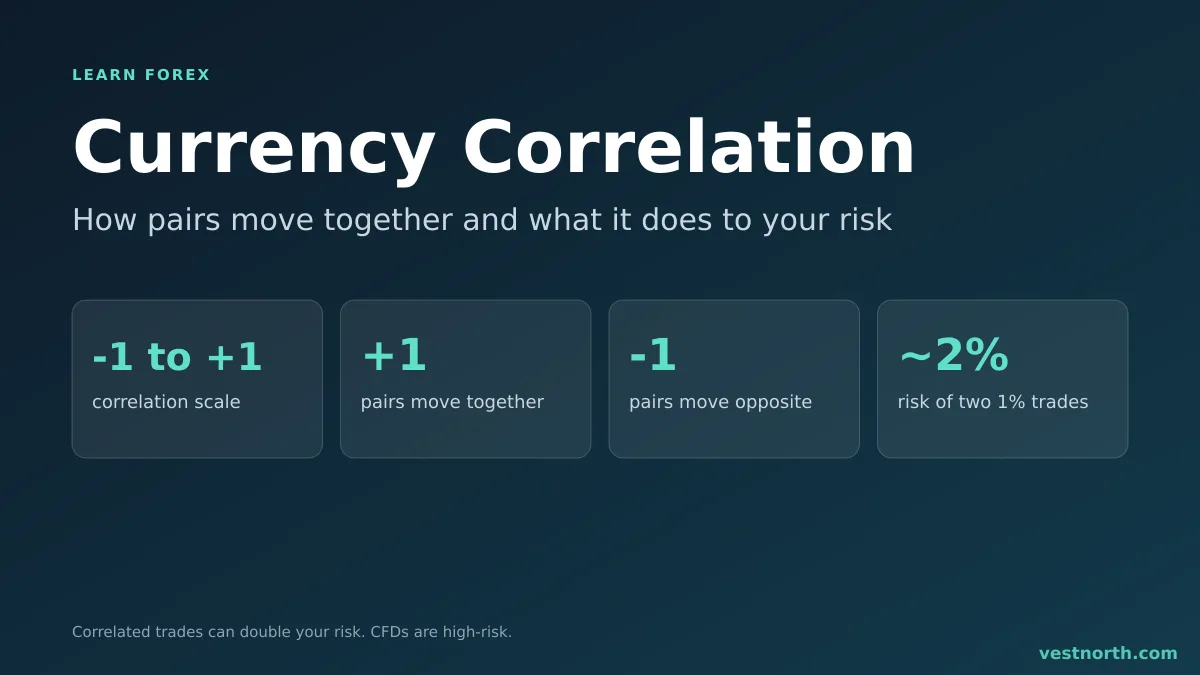
The correlation scale and two pairs sharing the US dollar. Illustration, October 2026.
What correlation means
Every forex pair contains two currencies. When two pairs share a currency, news about that currency tends to move both. A rise in the US dollar, for example, can push EUR/USD and GBP/USD down in the same session, because the dollar is the quote currency in both. That shared driver is the source of correlation.
Correlation is calculated from past prices over a chosen period, such as the last 20 or 100 daily candles. The result sits between -1 and +1:
| Value | What it suggests |
|---|---|
| About +1 | Pairs usually move in the same direction |
| About 0 | No steady link |
| About -1 | Pairs usually move in opposite directions |
A value of +0.8 does not mean the pairs move by the same number of pips. It only describes how often the direction agrees. Read what is a currency pair if base and quote currencies are new to you.
Positive and negative correlation
Two pairs with the US dollar on the same side, such as EUR/USD and GBP/USD, have often moved together. Buying both is mostly a bet that the dollar falls.
A pair with the dollar on the other side, such as USD/CHF, has often moved against EUR/USD. Buying EUR/USD and buying USD/CHF puts you on opposite sides of the dollar, so gains on one can be cut by losses on the other. Buying EUR/USD and selling USD/CHF points both trades at the same dollar view again.
The word “often” matters here. These links come from history, not from a rule. They can weaken when a currency has its own news, such as a central bank decision, which you can plan around with the economic calendar.
A worked example
You have a $5,000 account and a rule of risking 1% per trade, which is $50.
- You buy EUR/USD at 1.0850 with a stop at 1.0815, a risk of 35 pips.
- You also buy GBP/USD at 1.2700 with a stop at 1.2665, also 35 pips.
The lot size for each is $50 ÷ (35 × $10) = about 0.14 lot. On paper you risk 1% twice. But both trades are short the dollar. If the dollar rallies on strong US data, both stops can hit within minutes, a loss of about $100, or 2%, from what is really one idea.
A tidier plan is to take only the stronger setup, or to cut each trade to about 0.5% so the combined risk stays near 1%. The lot size calculator does the sum, and position sizing explains the method.
Calculating a correlation coefficient
Correlation is usually reported as a number from -1 to +1. +1 means two series move in step, -1 means they move in opposite directions, and 0 means no linear relationship. Charting platforms and spreadsheets compute it from daily percentage changes, not from prices, because prices that trend can look related by accident.
A small made-up illustration with six daily percentage changes:
| Day | EUR/USD | GBP/USD |
|---|---|---|
| 1 | +0.40% | +0.35% |
| 2 | -0.25% | -0.30% |
| 3 | +0.10% | +0.05% |
| 4 | +0.55% | +0.60% |
| 5 | -0.35% | -0.20% |
| 6 | +0.20% | +0.25% |
Putting these into a spreadsheet’s CORREL function returns about +0.97. Six days is far too few to rely on; the point is the mechanics. With real data, check at least a few months and compare more than one window, since the number shifts (see the next section). A high reading says the two trades are close to one bet, so the combined risk in your plan should be treated as one position, not two. Past correlation does not guarantee future behaviour.
Why correlation changes
- The period you measure. A 20-day figure and a 200-day figure can disagree.
- The time frame. Daily and 5-minute data give different readings.
- News. A central bank decision for one currency can break a link for a few days.
- Market regime. In a risk-off panic, many pairs move together that usually do not.
Because of this, treat any quoted correlation as a snapshot. We have not listed fixed values for pairs here, since they would be out of date quickly. Pull a current table from your platform or a charting service.
How to use correlation
- Count the currencies, not the trades. Before you open a second trade, list which currencies each leg is long and short.
- Cap combined risk. Decide a maximum total risk, such as 2% across all open trades, and count correlated trades together.
- Avoid the accidental double. Two entries on different pairs at the same time often come from the same news.
- Use it to spread out. If you want different bets, pick pairs that do not share a currency, such as EUR/USD and AUD/JPY. They can still move together in a market shock.
See risk management for how to set a total risk limit.
Common mistakes
- Treating a remembered correlation number as permanent.
- Opening three pairs with the same currency and calling it diversification.
- Hedging with a correlated pair and expecting a perfect offset. Spreads, swaps and different pip values leave a gap, as covered in what is hedging in forex.
- Forgetting that margin is used on each position, which raises the risk of a margin call.
Related reading: the US dollar index (DXY).
Bottom line
Correlation tells you whether two pairs tend to move together, not by how much. The practical use is to count how many trades share one currency and to keep the combined risk inside your limit. Check recent data, because the numbers drift. CFDs are complex, high-risk instruments, so only trade money you can afford to lose.
Frequently asked questions
What is currency correlation in forex?
Currency correlation is a measure of how closely two pairs move together over a period. A value near +1 means they usually move in the same direction, near -1 means they usually move in opposite directions, and near 0 means no steady link.
What do +1, 0 and -1 mean?
The scale runs from -1 to +1. At +1 two pairs move the same way, at -1 they move opposite ways, and at 0 there is no consistent relationship. Real pairs rarely sit exactly on these values.
Is correlation between pairs fixed?
No. It changes with the period you measure, the time frame and the news. A pair link that held last year can weaken or flip, so check recent data instead of relying on a remembered number.
Why does correlation matter for risk?
If you open two trades that share a currency, one move in that currency can hit both. Two trades each risking 1% can behave like one trade risking close to 2%.
Can I hedge with correlated pairs?
You can open trades that tend to offset, but the offset is never exact and each trade has its own spread and swap. It can also tie up margin without removing the risk.
How do I check correlation?
Many platforms and chart sites show a correlation table for a chosen period. You can also open the charts side by side and compare how both reacted on the same days.