Heikin Ashi Candles in Forex: How They Are Calculated and How to Read Them
Short answer: Heikin Ashi (Japanese for “average bar”) candles are built from averages of the regular open, high, low and close. The averaging removes much of the noise, so a trend shows up as a long run of same-coloured candles. The cost is lag, and the displayed open and close are calculated values, not traded prices.
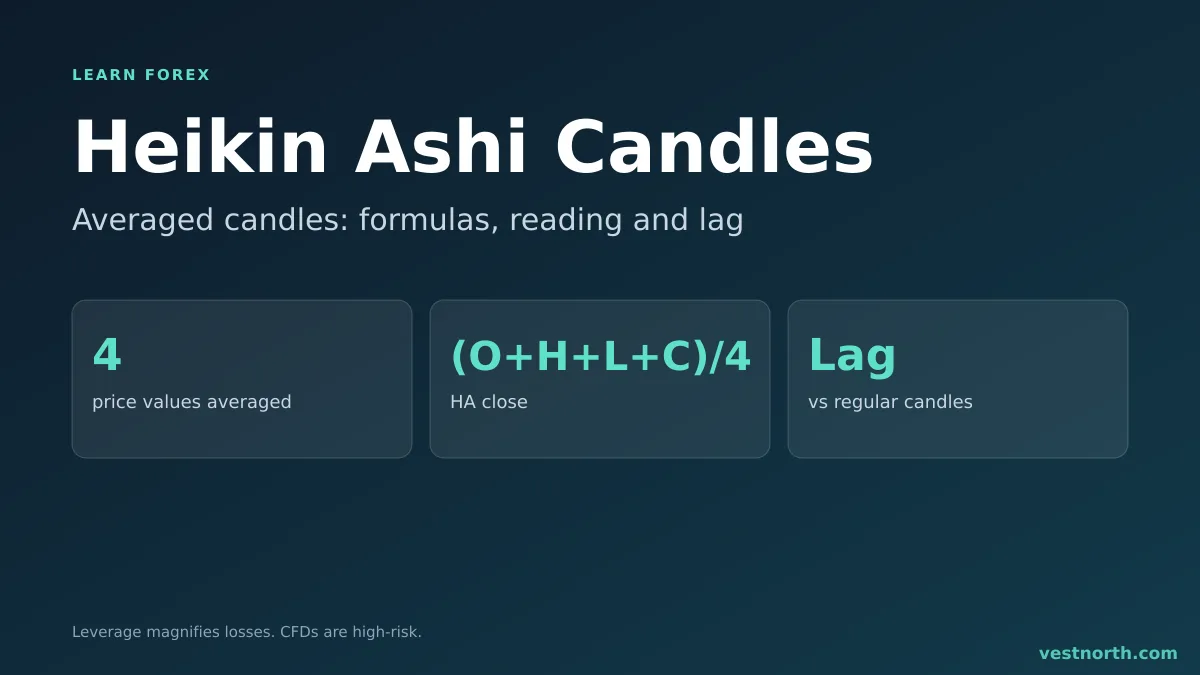
The same move on both chart types. Illustration, November 2026.
The four formulas
Each Heikin Ashi (HA) candle uses the regular candle’s values (O, H, L, C) and the previous HA candle.
| HA value | Formula |
|---|---|
| HA close | (O + H + L + C) ÷ 4 |
| HA open | (previous HA open + previous HA close) ÷ 2 |
| HA high | The highest of H, HA open and HA close |
| HA low | The lowest of L, HA open and HA close |
The first candle on the chart has no previous HA candle, so platforms usually start it with the regular open and close. Because each HA open depends on the one before it, small differences in the start point can change early values, and the chart converges after several candles.
Worked example on EUR/USD
Prices are illustrative, not a forecast. Suppose the previous HA candle had an open of 1.0840 and a close of 1.0852.
The current regular 1-hour candle: open 1.0852, high 1.0880, low 1.0848, close 1.0874.
- HA close = (1.0852 + 1.0880 + 1.0848 + 1.0874) ÷ 4 = 1.08635
- HA open = (1.0840 + 1.0852) ÷ 2 = 1.0846
- HA high = highest of 1.0880, 1.0846, 1.08635 = 1.0880
- HA low = lowest of 1.0848, 1.0846, 1.08635 = 1.0846
The HA candle is green (close above open), its body runs from 1.0846 to 1.08635, and it has no lower wick because the HA low equals the HA open. The regular candle opened at 1.0852 and closed at 1.0874, so the HA body sits lower and ends below the real close. That gap between displayed and real prices is the smoothing.
How traders read the candles
- Same colour for many candles. The trend is steady. A run of green HA candles in a rise, red in a fall.
- No lower wick on a green candle. The calculated open was also the low. This is often called a strong-trend candle.
- No upper wick on a red candle. The same idea in a downtrend.
- Small body with wicks on both sides. Indecision, like a doji. Momentum may be slowing.
- Colour change. A red candle after a long green run is a warning. It is not an instruction to sell.
Heikin Ashi is a display method. It does not add information that the regular prices lack, which is why traders usually pair it with a moving average, a trend line or support and resistance.
Heikin Ashi versus regular candles
| Feature | Regular candles | Heikin Ashi |
|---|---|---|
| Open and close | Actual traded prices | Calculated from averages |
| Noise | All of it shown | Reduced |
| Trend runs | Often broken by single opposite candles | Longer runs of one colour |
| Signal timing | Earlier | Later (lag) |
| Gaps between candles | Possible | Rare, since each open comes from the last candle |
| Price for orders | Reads directly | Check the live quote |
Patterns like the engulfing candle lose their usual meaning on HA charts, because the open and close are no longer the market’s prices. Switch to regular candles to read those.
The lag problem
Averaging four values and chaining each open to the last one means the HA chart reacts after the regular chart. In the example above, the real candle closed at 1.0874 but the HA close shows 1.08635. If price reverses sharply, the HA candle may still be green while the regular chart has already fallen.
Two effects follow:
- Late exits. A trader who waits for the first red HA candle after a long rise gives back part of the move. How much depends on how sharp the reversal is.
- Whipsaws in ranges. In a sideways market, HA colours flip often and the smoothing helps less. A range market is a poor fit.
Stops and entries on an HA chart
Use the regular price for orders. If a trader takes a long on a green HA candle and puts the stop under the HA low of 1.0846, the stop is a calculated value, not a level the market traded at. Check the regular chart and place the stop beyond a real swing low, then size the position from the distance. The stop loss guide and the position sizing guide cover the steps.
For a 1-hour chart where the nearest real swing low is 1.0830 and entry is 1.0875, the stop distance with a 5-pip buffer is 50 pips. Risking 1% of $5,000 ($50) means about $1 per pip, or 0.10 lot on EUR/USD with a USD account.
Settings and common mistakes
- Mixing both chart types on one screen without labels. Prices on the two will differ and cause confusion.
- Placing orders at the HA price. It may never have traded.
- Using it on very low timeframes. Spread and noise swamp the smoothing.
- Treating colour as a signal. A green candle in a rangebound market means little.
- Expecting profits from the chart type. It changes how data looks. It does not change the market or your costs.
We have not backtested Heikin Ashi rules and publish no win rate. To test an idea, apply a fixed rule to past charts on a demo account and count the results with costs included.
Bottom line
Heikin Ashi candles trade detail for clarity. They make trends easier to see and exits easier to hold, and they delay every signal. Read the colour runs and wicks for context, then confirm levels on the regular chart before you place an order. Leveraged trading can lose money quickly, so only risk what you can afford to lose.
Frequently asked questions
What are Heikin Ashi candles?
They are candles built from averages of the regular open, high, low and close instead of the raw values. The averaging smooths the chart, so trends show as longer runs of one colour.
How is the Heikin Ashi close calculated?
It is the average of the regular candle's open, high, low and close: (open + high + low + close) ÷ 4.
How is the Heikin Ashi open calculated?
It is the average of the previous Heikin Ashi candle's open and close: (previous HA open + previous HA close) ÷ 2.
Do Heikin Ashi prices match the real price?
No. The open and close of a Heikin Ashi candle are calculated values and can differ from the traded prices. Use the regular chart or the order ticket for actual entry and stop levels.
What does a candle with no lower wick mean?
On a green Heikin Ashi candle with no lower wick, the candle's calculated open equals its low. Traders read that as a steady rise with no pullback below the open in that period.
Do Heikin Ashi charts predict reversals?
No. They smooth what has already happened and lag the regular chart. A change in colour or a small body is a warning that momentum is slowing, not a forecast.
Can I place orders from a Heikin Ashi chart?
Most platforms let you, but the prices on the chart are averages. Check the live bid and ask in the order window before you set an entry or stop.